| Return Distributions |
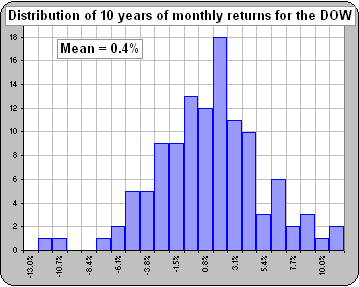
Remember when we looked at the distribution of monthly returns for the DOW? 
To get some idea of the variability of returns or future portfolios (or midday temperatures or the range of house prices ... or whatever) we can plot a distribution. We just look at, say umpteen scenarios (like the last umpteen annual returns) and see how many are between -10% and -9%, or between -9% and -8%, or between -8% and -7%, or ... >Okay! Then what? |  |

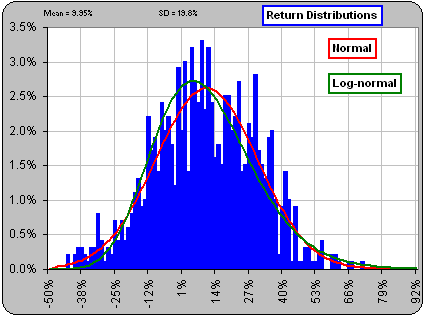
Since the distribution will be pretty jagged, one attempts to find some congenial curve that'll mimic the ragged distrubution, like so-called Normal or Lognormal curves.
>Why?
If you have a neat mathematical description for the distribution, then you can play mathematical games.
You can discard the actual distribution and use the mathematical proxy to attempt to predict future portolios or the probability of your portfolio running dry when you withdraw too much money each month or
you can try to pick out some "expected" future return or you can ...
>And that works?
It's a handy gadget to play with ... but don't count on it! 
You have a variety of financial tools. You use this and that ... then stand back and ponder. Cerebral machinations are requisite.
See:
- Return distributions
- more on Distributions
- Other distributions
- a Mystery distribution
- Johnson curves
- Using distributions to predict
- Latin Hypercube
- Random Walks
- Omega
- Copulas
|
|
 to continue