| another Distribution ... continued from here |
Once upon a time we talked about a distribution of returns with Mean = m and Volatility = s, but one that'd give fatter tails and ...
>Is that your Mystery Distribution?
No. Here we want to consider yet another distribution of the form:
(1) f(x) = A e-b SQRT( 1+k(x-m)2 )
where we need to choose the numbers A, b and k appropriately. In particular, to mimic the behaviour of some stock returns.
|
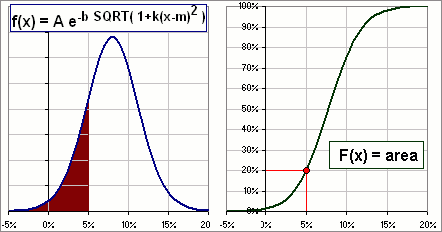
The cumulative distribution is determined by the area beneath the f(x) curve and denoted by: F(x) =  f(u) du f(u) du
>Huh? The probability that x will be less than, for example, 5% is F(5) = 20% as shown on the right-most picture, in Figure 1. >And that 20 is the area under the f-curve? Yeah, the area to the left of x = 5%. |  Figure 1 |
F(∞) =
 = 1
= 1
>Is it equal to "1" or "100%"?
They're the same: 1 means 100%.
Now we'll search for appropriate values for A, b and k.
Note that, when z is close to 0, SQRT(1+z) = (1+z)1/2 = 1+z/2 ... approximately.
So, when x is close to its Mean m, SQRT(1+k(x-m)2) = 1+k(x-m)2/2 (approx.)
so we can write f(x) as:
f(x) = A e-b(1+k(x-m)2/2) = Ae-b e-bk(x-m)2/2 (approx.)
This is the form we'd expect since the Normal distribution has this form, namely:
f(x)normal = 1/SQRT(2π) e-(1/2)(x-m)2/s2
In order to match these characteristics near the Mean, we set
bk = 1/s2 or b = 1/ks2
That gives:
(2) f(x) = A e-1/ks2 SQRT( 1+k(x-m)2 )
Since we also want  = 1 we choose A so that
 A e-1/ks2 SQRT( 1+k(x-m)2 )dx = 1
That makes A a function of k, so we'll write:
| (3) A(k) = |     
 e-1/ks2 SQRT( 1+k(x-m)2 )dx e-1/ks2 SQRT( 1+k(x-m)2 )dx
|
>But A depends upon the Mean and Standard Deviation as well, right?
Yes, but we know the numbers m and s ... assuming we're trying to mimic the distribution of returns for some particular stock.
>Altogether now?
Yes. Altogether now:
| 
|
>So what's k?
Like I said, we choose it so as to mimic the distribution of returns for some particular stock.
>Well, you're gonna have fun evaluating A, eh?
Not on a spreadsheet. Here's what we'll do:
>Yeah, so?
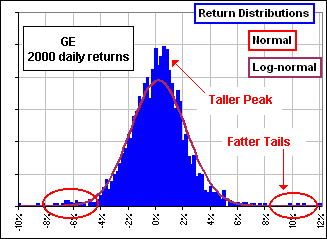
|  Figure 2 |
 Figure 2A |
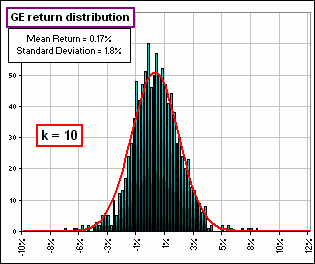
>Why k=10? Actually (it surprised me!), the chart of f(x) is relatively insensitive to your choice of k.  Figure 2B |
Aah, yes, the tails. I guess that's because we tried to match the actual distribution near the Mean - and that's near the peak.
But the tails, they're ... uh ...
>Fat!
Well, fatter, for large k-values, but the peak drops a bit. So we have to compromise between matching the peak and the tails.
Here's a few more:

Figure 2C
>Okay, but how do you evaluate A(k)?
You mean:  e-1/ks2 SQRT( 1+k(x-m)2 )dx ?
I do a sum, like so, for a bunch of j's:
Σ e-1/ks2SQRT(1+k(xj-m)2)Δx
>Huh?
Don't worry about it.
Remember when we noted that actual returns can sometimes be extreme ... far more (or less!) than one would expect from a Normal or Lognormal distributions.
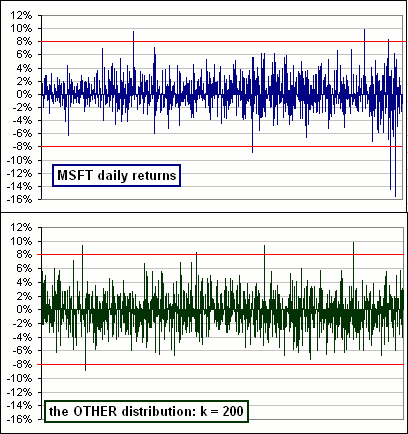
(See this chart where the upper chart with the wild returns is real whereas the lower is fictitious, based upon a Normal distribution with the same Mean and Volatility.)
|
In Figure 3 (top chart) we have the daily returns for MSFT (for the past ten years).
If the distribution were Normal (for example) then, as it turns out, we'd expect a return outside the range -8% to 8% once or twice. In fact, there were ... >I count 6!
On the other hand, if we try to mimic the MSFT returns using our OTHER distribution we can get lots of returns outside (-8%, 8%). >And the match? I mean the actual distribution vs ...
|  Figure 3 |
Yes, of course. What would you suggest?
>I'd suggest ... uh, picking a k which works. So, where's the spreadsheet?
I'm thinking about it ...


