| re-Balancing your Portfolio |
"What is likely to surprise most investors is that adding international assets to a portfolio during a period when they underperformed actually resulted in higher returns and lower risk"
|
>And you said, "Ya gotta be kidding," right?
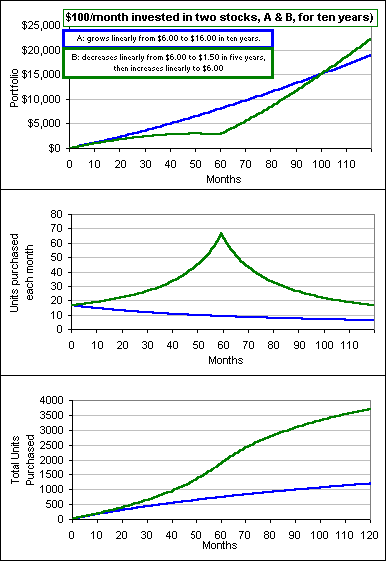
>You buy more units at the low price with your investment dollars, eh?
>Yeah. Stock A increases over ten years and stock B goes nowhere. It ends up ...
>Because of the increase of stock price from $1.50 to $6.00, eh?
>And doing this "periodically" is what reminds you of DCA. Am I right?
>Yeah. A is stocks and B is bonds.
| 
|

|
We consider two asset classes. We'll call them A and
B.
Whereas A increases linearly in price over a certain period,
B decreases
for the first half of the period then increases during the second half, ending up with a
smaller annualized gain over, say, twenty years. The result is ...
>I know! You sell some of the good stuff and buy some of the lousy stuff and ...
|
|
>Why rebalance once a year? Why not ... ?
>Did you say Monte Carlo probability?
>And? |
 |

>I take it the charts don't include trading charges.
Right. But for a more strategic time to rebalance
perhaps, you can
take a peek at this Strategy or, if you really want to know when to rebalance,
check this out :^)
>And why 25% or 30%? Is that some optimal percentage? Is that the best ...?
Of course not. I'm just giving you an example. I could just as easily ...
>And I assume that when you put money into the poorer performing
sector you're expecting some dramatic future gains.
Quite true. Here's some other pictures which don't make such simple-minded price changes
in the two asset classes:
 |
 |
>Where did these charts come from? Did you ...?
I generated them with a spreadsheet, the price changes in the two asset classes being
generated randomly every time I pressed F9 to re-calculate and ...
>You haven't indicated how the shares change, how you decrease one asset and ...
Here's a picture of the spreadsheet:
 |
Right-Click on the picture, above, and "Save Target" to download the .ZIPd spreadsheet
>And why just two component? Why not lots more, like Domestic Large
Cap Stocks and Fixed Income Mutual Funds and Cash and Foreign Large Cap and ...
I'll consider it. In the meantime, here's a chart which has three asset classes,
including the EAFE Index (Europe, Australasia and Far East) and, although the annualized
gain was smaller than U.S. Large Caps, the Volatility was reduced. In this chart
we buy a bunch in 1978, rebalance yearly, and watch:

>And what about some of your mathematical bumpf? Can't you
prove anything? Have you lost your formulas? Have you ...?
I said I'll consider it.
>Stop interrupting.

 for Part II