| When to Rebalance |
There's been plenty of discussion about how often to rebalance in order to maintain some fixed asset allocation.
>Like 60% Stocks and 40% Bonds?
Exactly. Suppose that, each period
(which may be days, weeks, months...), our returns are
r1, r2, r3 etc., and, after m such periods we rebalance.
Our portfolio will have grown
by a factor given by a Magic Formula
... which we obtained in
Rebalancing Bonus
|
If m-period Gain Factor is Gm =
Π (1+rk)
= (1+r1)(1+r2)...(1+rm)
then the per period Gain Factor is: G = 1 + Mean - (1/2)Variance ... approximately where Mean = (1/N)Σrk = (1/m)(r1+r2+...+rm) and Variance = StandardDeviation2 = (1/m)Σrk2 - [ (1/m)Σrk ]2 |
|
>Approximately?
Yes, when the returns rk are small and ... >And if my return is 50%, is that small? We'll be talking about monthly periods ... hence monthly returns. We'll assume they're small enough. >How small is small? Oh ... say 1% (so, for a monthly return, we'd put r = 0.01). Below we'll also use the approximation *** (1+r)n = 1 + r n. >Approximately? Yes, as in the pretty picture where the error is about 3.5% for m = 30 
| 
|
Okay. We start with a portfolio of $A and devote a fraction x to Stocks and the balance y = 1 - x to Bonds. ... or any two asset classes. We suppose:
- During the next m months, the monthly Stock returns are s1, s2, ... sm
- ... and the monthly Bond returns are b1, b2, ... bm.
- The Stock component of our Portfolio, namely x A, will have grown by a factor given by our
Magic Formula, becoming:
x A [ 1 + Mean(stocks) - (1/2)Variance(stocks)]m, or, approximately:
x A [ 1 + m{Mean(stocks) - (1/2)Variance(stocks)}] using ***, above. - The Bond component of our Portfolio, namely y A, will have grown by a factor given by our
Magic Formula, becoming:
y A [ 1 + Mean(bonds) - (1/2)Variance(bonds)]m, or, approximately:
y A [ 1 + m{Mean(bonds) - (1/2)Variance(bonds)}] using ***, above. - Adding, we get our Total Portfolio after m months, namely:
A {1 + m[xMean(stocks) + yMean(bonds) - (x/2)Variance(stocks) - (y/2)Variance(bonds)]}
where we have used the fact that x + y = 1, so xA + yA = A - We conclude that, after m months, our Portfolio has grown by a Gain Factor:
G(m) = 1 + m[xMean(stocks) + yMean(bonds) - (x/2)Variance(stocks) - (y/2)Variance(bonds)]
Sorry, I forgot. Approximately!
Since our Portfolio has grown to G(m)A after m months, we rebalance so that our Stock component becomes a fraction x of this new Portfolio and our Bond component a fraction y: that's xG(m)A and yG(m)A, respectively.
But now we can repeat the above scheme umpteen times, meaning that we're letting our Stock and Bond components sit for m months, then we rebalance, then they sit for another m months, then we rebalance, then ...
>Yeah, yeah. I get it!
Okay, if the Mean and Variance don't change dramatically as the months pass, then we can continue this
prescription for N months.
>If we rebalance every m months, then the number of rebalancings is N/m, right?
Yes, and since our Portfolio increases by the above Gain Factor with each rebalancing,
our final Portfolio is then G(m)N/m.
>And we pick m so it's a maximum, eh?
Yes. Since G(m) has the form 1+r m, then G(m)N/m = (1+r m)N/m.
|
>And now you use that *** thing, right?
You put G(m) = 1 + (N/m) rm = 1+Nr, right? Hardly. The error here is too large. Check out this pretty picture >Aha! You want it to depend upon m so you massage the math so you get an answer you like? Is that it?
| 
|
It's r = xMean(stocks) + yMean(bonds) - (x/2)Variance(stocks) - (y/2)Variance(bonds).
It's like an annualized return, except here we're talking monthly, so it's the ... uh, monthlyized ...
|
>Can we call it the Compound Monthly Return?
Good! We'll call it the CMR. The graph of (1+r m)N/m looks like Figure 1, for r = 1% (that is, r = 0.01) and N = 100 months. It shows the 100-month Gain Factor vs m. >So we should pick a small value for m. Rebalance every minute?
>Okay, I'd rebalance every m = 15 months or so.
>Starting with a $1.00 portfolio? But that's still 1%.
>You keep saying that our Portfolio increases. Mine always decreases and ... |
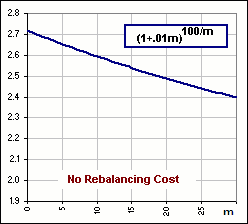 Figure 1
|
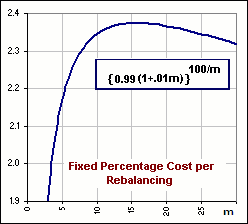
Our $1.00 changes to (1+r m) after m months, then we rebalance and that costs us c cents so we have
(1+r m)-c.
That gets multipied by our m-month Gain Factor again, namely (1+r m), giving us
(1+r m){(1+r m)-c} = (1+r m)2 - c(1+r m).
We rebalance again, subtracting our fixed cost of c cents, leaving us
(1+r m)2 - c(1+r m) - c.
Over the next m months, that gets multiplied by (1+r m) again, then we subtract our c cents ...
|
>zzzZZZ
Okay, I get the hint. The final Portfolio is (1+r m)N/m - c/(rm) {(1+rm)N/m - 1}. A sample is shown in Figure 3, for c = 0.01 (that's 1 cent) and r = 0.01 (that's a 1% CMR) and N = 100 (that's a 100 month scenario). >Aha! I choose m = 12 months. That's annual rebalancing, eh?
>Yeah, so? It does suggest that there'll be a "best" rebalancing period, no?
>Wait! Don't tell me. Monte Carlo?
|
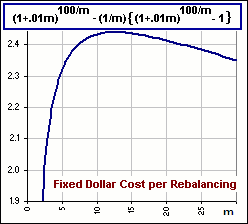 Figure 3 |
To confuse you with mathematical hocus pocus

Okay, here's what we'll do:
- We'll split our Portfolio between two asset classes, like Stocks and Bonds.
- Each month we select a random monthly return for the Stock and the Bond component.
- We rebalance every m = 1 month to maintain, say, 60% Stocks and 40% Bonds.
- We continue for N = 100 months ... and look at our final Portfolio.
- Then we repeat steps 1, 2, 3 and 4 with m = 2 months
(so now there are just N/m = 50 rebalancings, over the 100 months). - Then we repeat for m = 3, 4, 5, ... up to a rebalancing period of m = 30 months.
>And the monthly returns for the two assets are random?
Yes, though their Mean and Volatilities are specified and we'll assume that the monthly return distribution is lognormal.
>And?
|
And we get something like Figure 4 where the 30 Portfolios are shown, for each m-value
(starting with $100K and running for 100 months).
>So who wins?
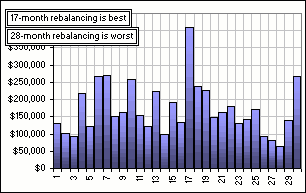 Figure 5 |
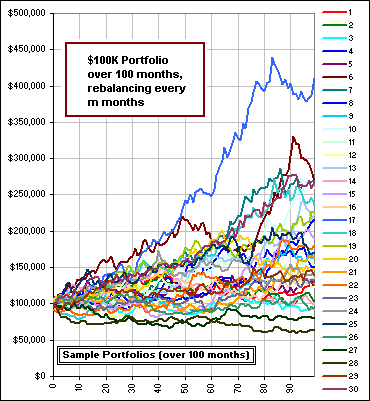 Figure 4 |
>Those thirty graphs, in Figure 4, they're pretty wild. I mean, just about any one could be the winner at N = 200 months.
Indeed, so we shouldn't take it too seriously because ...
>But m = 17 is so far out in front, I'd choose rebalancing every 17 months.
Go ahead. It's your money.
>I assume you did this with some spreadsheet.
Yes. There's a picture of the spreadsheet; it looks like this,
with an explanation like this.
>But that picture of the spreadsheet has m=17 months the worst! I'd avoid 17 ...
Go ahead. It's your money.
Here's a couple more for your entertainment ... and edification:


>Can I play with the spreadsheet?
Sure. Just RIGHT-click here, and Save Target.
>So what's your conclusion, about when to rebalance?
When to rebalance? You mean which m to choose? You mean always rebalancing after a fixed number of months. You mean rebalance whenever the calendar
screams REBALANCE? You mean ignore market gyrations? You mean ...
>Yes, yes! That's what I mean!
Well, I'll tell you my strategy:
- Look a number of years into the future.
- Identify the monthly returns for your two (or more) asset classes.
- Run the numbers through a spreadsheet, using various m values.
- Pick the best rebalancing period.
>Very funny.
>Of course, you've just considered an initial Portfolio without additional investments and ...
See Rebalancing. In particular, stare intently at the chart below,
on the left, where we invest each year and we compare the result of rebalancing every 2, 6 or 12 months and its dependence upon the mix of
Stocks/Bonds and we do the Monte Carlo thing to see if we could achieve $1M in thirty years and we use, as the Stock
component, actual S&P 500 returns and ...

|
>Okay! I can read what it says!
Yes, but notice that there is little to choose between rebalancing every 2 or 6 or 12 months so ...
>And you?
>I'm sorry I asked. |
See also a Strategy (maybe:^)
and perhaps Stocks & Bonds
and maybe Stocks & Bonds & Frontiers
and maybe ...
>zzzZZZ
