| Monte Carlo Simulation: a continuation of part I |
The purpose of this part is to ... uh, play with the Monte Carlo spreadsheet ...
>Play? Good!
... to see what we can see, realizing, of course, that we're not predicting the future but
investigating the dependence of a final portfolio upon stock and bond volatility and inflation
and ...
>Can we get on with it?
First off, let's assume we're sixty years old and would like see the evolution of our retirement
nestegg over the next thirty years. We pull out the spreadsheet and try to invent some
stock return and volatility and decide upon whether to use Normal or a Log-normal distribution
of returns or ...
|
>Can we get on with it! Okay. In fact, we stare at the distribution of S&P500 monthly returns from Jan, 1926 to May, 2001 and look at Normal or Log-normal distributions with the same Mean and Standard Deviation and ... >And decide to go with the S&P, right? Right! The S&P500 monthly returns seem more crowded about the Mean than the smooooth Normal or Log-normal distributions which suggests a smaller Volatility but the S&P had some monstrous returns - actually lying outside the chart window - like 1929 and there was a crash in 1987 and some phenomenal years in the late 1990s and that increased the Standard Deviation which, after all, involves the square of the deviation from the Mean so that ... >I get it. Please continue. Just one other thing, okay? | 
|
>Please continue.
Okay. We go with S&P returns, but choose the Bond parameters and inflation etc., and get a result like so:
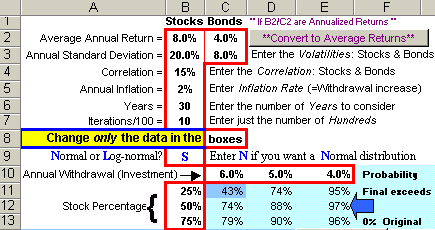
>But you stuck in parameters for stocks ... Mean equal to 8.0%, Standard Deviation equal 20.0% and ...
Yeah, but I also put an S into cell B9 meaning I wanted
S&P stock returns so the spreadsheet ignores the stock parameters and selects S&P500 monthly
stock returns, at random. These monthly returns are built into the spreadsheet. Anyway, I
look at the
3-by-3 matrix and decide to choose 75% stocks (hence 25% bonds) and a withdrawal rate of 5%
so the spreadsheet says there's a 90% chance of achieving my goal.
>Whew! We're talkin' big money here!
>Which is?
Which is to have my portfolio last for thirty years.
>And you believe that? You have so much faith in ...
This is all fiction, but I need some guidance in planning my retirement, and the spreadsheet
does give me some feeling for ...
>But how much money do you need, to start your retirement?
Good question. If I'm retiring now I figure I'll need $50K a year and, at a 5% withdrawal rate,
that means a portfolio of 20 times that amount or $1,000,000.
Yes, so now we move to the other spreadsheet and ...
>The other spreadsheet?
Yes. The one that gives us an indication of how much we'd have to put away each year to
end up with a $1,000,000 portfolio.
>What! You just said you're sixty years old and now you want to
start saving for your retirement?
Now I'm thirty years old and I want to end up with a $1,000,000 portfolio when I'm sixty so I ...
>Do you practise obfuscation or is it genetic?
Pay attention. Here we go:
Here's a picture of the other spreadsheet: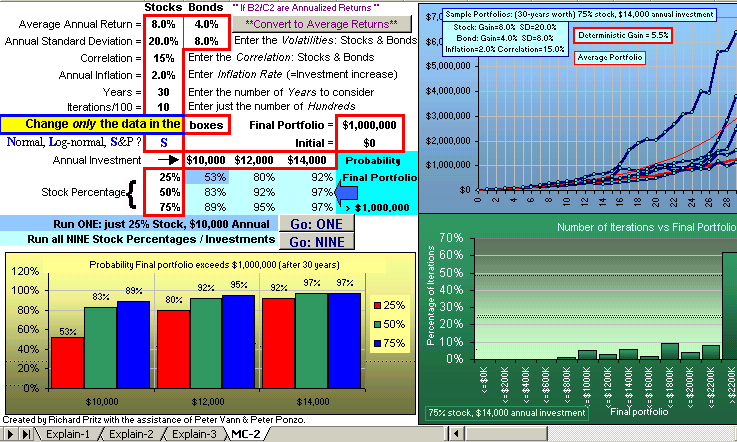
|
I again choose S&P500 stock returns and parameters as shown above and mouse-click on
Go: NINE to see all NINE scenarios. However, a window pops up | 
|
>So you'll have to ask for a $2,000,000 portfolio in order to keep up with
inflation. And that's only 2% inflation! What if it were more? What if ...?
What if? You say What if? Precisely!
- What if inflation were 3% or 4%?
- What if I wanted to retire after just twenty-five years?
- What if I got a guaranteed 3% on "bonds", so I can put the "bond" Standard Deviation = 0%?
- What if we think the future will be very different from the past,
so we forget historical S&P parameters and invent other stock parameters? - What if the volatility is huge, in the future?
- What if ... ?
>You're trying to tell me something, eh?
I'm saying that Monte Carlo simulation is great for answering What if questions, but ...
>But don't bet the farm.
You got it.
>Can I play?
Sure. Right-Click on the picture of the spreadsheet, above, and Save the file (don't save the picture!). It'll download as a .ZIPd file.
>That's the "other" spreadsheet. What about the "first" ...?
Go to Part I.
Do not pass GO.
Do not collect $200.
There's yet another spreadsheet (!) which you may prefer, 'specially designed for
Saving for Retirement. It's described
here.
>How many spreadsheets do you have?
Don't ask.
Since the Deterministic curve is the centre of the possible portfolios (sort of) then (recognizing that there may be wild swings about this deterministic portfolio, for volatile investments), then you may want to play ... to see how long a deterministic portfolio would last if you withdraw a certain percentage of the original porfolio balance, this amount increasing with inflation:


