| a Time Machine |
|
Remember when we talked about comparing stock price behaviour over the current month to historical months?
>No.
Anyway, I ran across a website that mentioned this comparison spreadsheet.
However, the author does one better: He identifies the five best historical matches and extrapolates from all five.
|  DOW: extrapolated |

Anyway, I've modified the spreadsheet to allow you to go forward or backward to check out all the "best" matches. 
Now that's great fun!!
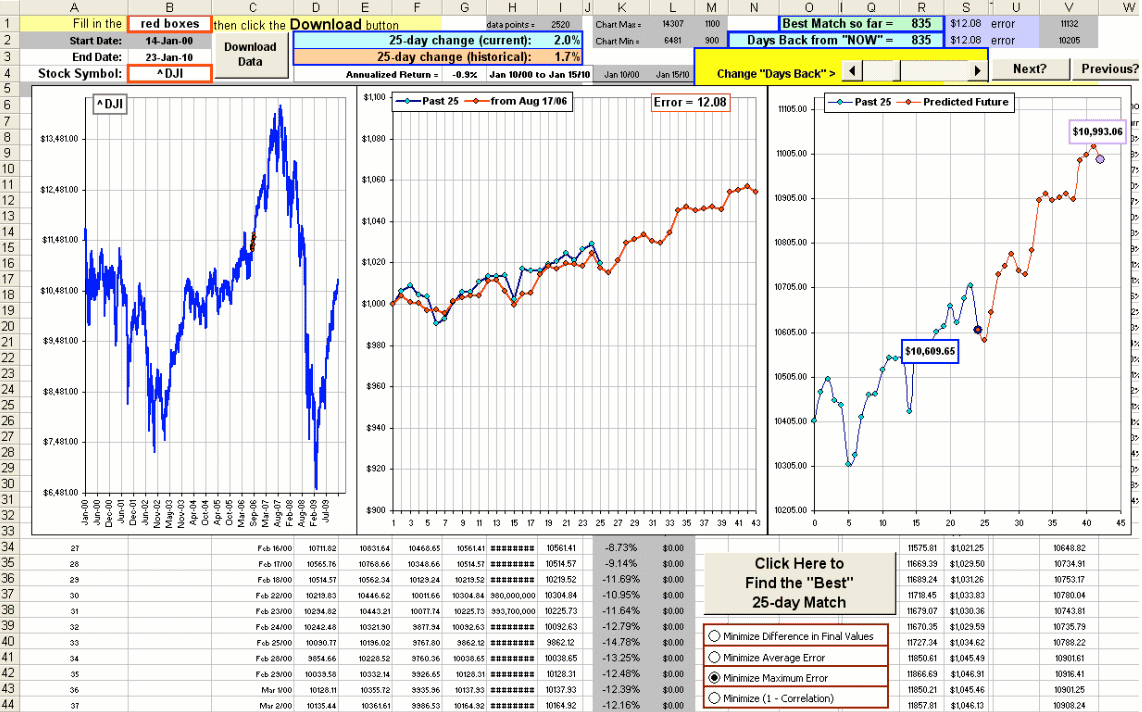
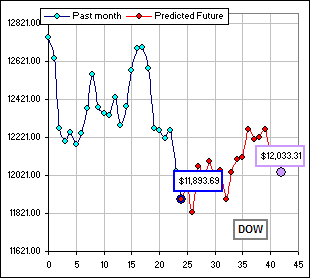
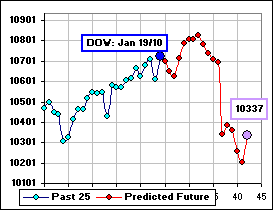
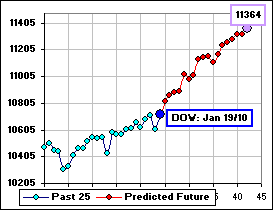
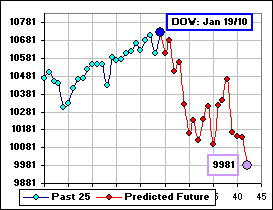
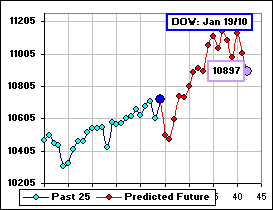
Here's what I get for the DOW (where, by "best", I minimize the max |error|:
 Best match: Max|error| =11.63 |
 2nd-Best match: Max|error| =14.46 |
 3rd-Best match: Max|error| =17.76 |
 4th-Best match: Max|error| =19.23 |