| Spearman Rank Correlation |
Once upon a time we were talking about cointegration and ...
>But you never finished?
Uh ... yes. I lost interest and ...
>You do that a lot!
Pay attention!
We wanted to look at two time series, say the prices for two stocks over some time period and ...
>To see if they move up and down together, right?
Yes, similar trends. It's a kind of correlation we're looking for but ...
>Use Pearson correlation, eh?
Must you interrupt!
Look at Figure 1. It shows two pairs of stock prices, one starting at $10 and the other starting at $20 and we see that ...


Figure 1a Figure 1b
|
>I'd say 1a has a small correlation and 1b has a high correlation. Am I right?
When using Pearson correlation, it's customary to consider the relationship between the returns, for each stock. For the stocks in 1a, above, even though the stock prices have little in common ... the returns are highly correlated as shown in Figure 2. >Highly correlated? Are you kidding?
| 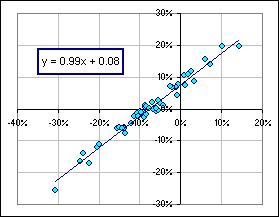 Figure 2 |
On the other hand we could use the correlation between the ... uh, Ranks between the two stock prices and get the Spearman Rank Correlation. For the two examples above, Figures 1a and 1b, we'd get:
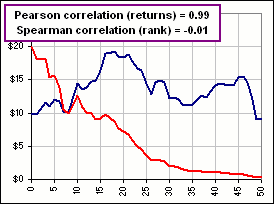
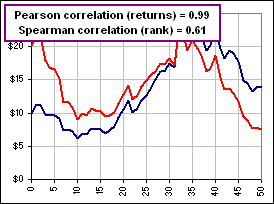
Figure 3a Figure 3b
>Just like I said: the first has small correlation and the second has a high correlation.
Yes, if you use Rs, the Spearman Rank Correlation.
>So, what's that Rank stuff?
That's what I want to talk about ...
>Wait! Your examples above were just inventions, right?
Yes, but ...
>So do you have any real, live examples ... with real stocks?
Here's General Motors compared to Ford ... then to Microsoft:

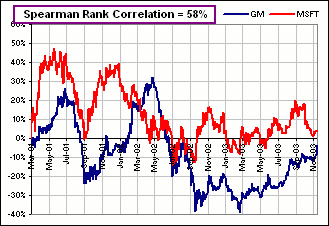
Figure 4a Figure 4b
>Okay, so what's that Rank stuff?
Did you know that "rank" can mean repulsive, offensive and ...
>Yeah? So what's that Rank stuff?
Okay, here's what we do:
We make a table of prices for stock #1, then we determine the rank of each price:
The largest price has rank = 1, the next largest rank = 2 etc.
Then we repeat for stock #2.
| 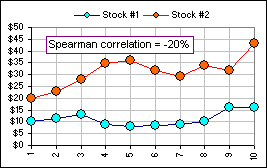 Figure 5 |
>Did you say "comparing ranks"?
Yes, we throw away the prices and take the Pearson correlation between the Ranks.
For our example that's the correlation between the sequences:
[6, 4, 3, 8, 10, 9, 7, 5, 1, 2]
and
[10, 9, 8, 3, 2, 5, 7, 4, 6, 1]
>Did you say "Pearson correlation"?
Yes. The Spearman Rank Correlation is just the Pearson Correlation between the Ranks. Neat, eh?
Further, Pearson is used to determine a linear correlation, as in Figure 2. Spearman doesn't even deal directly with the stock prices.
We could, of course, consider the Pearson coefficient of stock prices instead of returns and it'd be pretty close to Spearman.
For example, the correlations between the DOW and the NASDAQ over the past couple of years (using daily prices) are:
| 
|
And for General Motors and Eastman Kodak:
| 
|
So you can see ...
>For your example, that Pearsman correlation ... uh, that Spearman correlation is -20%, right?
Right ... if you're referring to Figure 5. And it's Pearson, not Pearsman.
>Did you know that Pearsman and Spearman have the same letters? No wonder I'm confused!
Go back to sleep.
>You just move the S to the front, so it's S then P. Hey! That's S&P! Get it?
Go back to sleep.
>zzzZZZ
There's a spreadsheet available. It gives charts like Figure 4 ... after you type two stock symbols and click a button 
Just click here.
The Spearman Rank Correlation can also be calculated using:
|
where d1, d2, ... dn are the differences between the individual ranks. For the above example:
Σ dj2 =
42+52+52+52+82+42+02+12+52+12 = 198
|
