| Sister Stocks ... a continuation of correlation stuff |
Okay, here's what we want to do:
- Download five years worth of daily stock prices, for 3 stocks and some "benchmark" stock or index.
- Calculate, in some way, how well the three stocks mimic the benchmark.
- Look carefully at each month in that 5-year progression to see when there are major deviations from the benchmark.
- Identify ...
>Wait! I have no idea what you're talking about!
If stock XYZ mimics the benchmark in some way, then we'll call the XYZ and the benchmark: "sister stocks".
Then, when there's a dramatic change, we want our analysis to cry out:
"Here's where the stock diverges from it's historical relationship to the benchmark !!"
>Yeah, so?
So I have this spreadsheet. It looks like this:
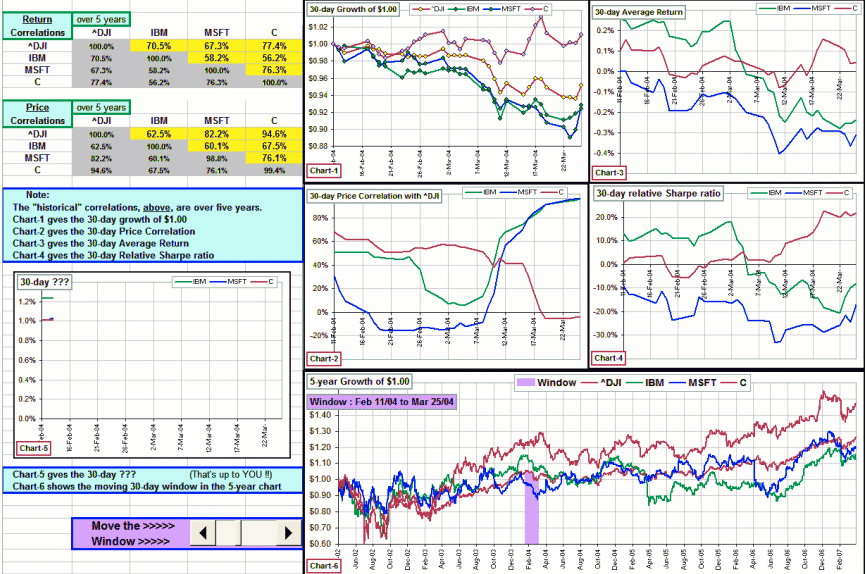
Here our benchmark if the DOW and the three stocks we're investigating are IBM, MSFT and C.
Look carefully at Chart-6. It shows the growth of $1.00 invested in each asset and there's also ...
>I put my money on C!
Pay attention! On Chart-6 there's a 30-day window that you can move along over that 5-year period.
>Huh?
Like this. When you move that 30-day window you get a bunch of 30-day charts.
Our problem is to ...
>See when a stock diverges from it's historical relationship to the benchmark, right?
Exactly. We might look at the 30-day Price Correlations (compared to the 5-year values), or the average daily return
or maybe the Relative Sharpe Ratio.
We might also want to invent some other 30-day thingy to look at, in Chart-5. I leave that up to you. 
)
>Relative Sharpe Ratio? Who's he?
Remember the Sharpe Ratio? You look at the average stock return, subtract some risk-free rate then divide by the standard deviation of the stock.
In our case, instead of some risk-free rate, we're substituting the 30-day average benchmark return ... so it's a Sharpe, relative to the DOW.
>And what do I do with Chart-5?
I told you! That's up to you. I have no idea how to find "sister stocks". Maybe you'll discover something neat ... so just stick in your own stuff.
>You're kidding, right?
Would I kid you? 
Notes:
- See also Pairs Trading
- The stuff that goes into Chart-5 is over in columns AN to AQ:

- If'n you're interested in this Relative-Sharpe-Ratio-thing, you can play with a spreadsheet here:
relative-sharpe.xls
It looks like this.
)
