Stock Predictors ... or Cousins 
|
Once upon a time we talked about Sister Stocks where we got us two stocks that tend to move together.
When there's a dramatic deviation from their historical relationship, then we consider buying or maybe selling and ...
>Assuming they'll soon return to their historical association, right?
You got it. Often, you're comparing a stock to some benchmark.
Anyway, here we want to talk about ... uh, cousins. Stocks that aren't that close, but separated by a few days or weeks.
|
>Huh?
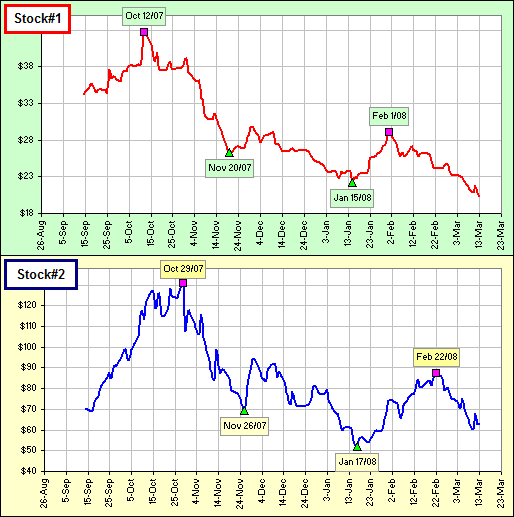
We'd like to have two stocks, Stock#1 and Stock#2, where Stock#1 tends to make its moves in advance of Stock#2. >Huh?
>You mean #1 predicts the movement of #2?
>You're kidding, right? Stock #1 tells you when to buy or sell #2?
>You're dreamin'. Figure 1 is an invention. If I knew how to predict like that I wouldn't be listening to you. I'd be ...
>I assume you're investing in #2 and looking for #1 to tell you that a buy or sell is coming up ... soon.
|  Figure 1 |

Then there are pairs that have little or no relationship:

>And then there's your invention ... in Figure 1, eh? 
Yeah, Figure 1.
>It is an invention, right?
Uh ... actually it's the past few months of GM and DRYS.
>And you've actually made a bundle on the predictive characteristics of GM, vis-a-vis DRYS??
If I'd made a bundle I wouldn't be talking to you. I'd be ...
>Sitting in your mansion in the Caribbean sipping Piņa Coladas ... yeah, I know. So where's the spreadsheet?
Patience ...
| Searching for Cousins |
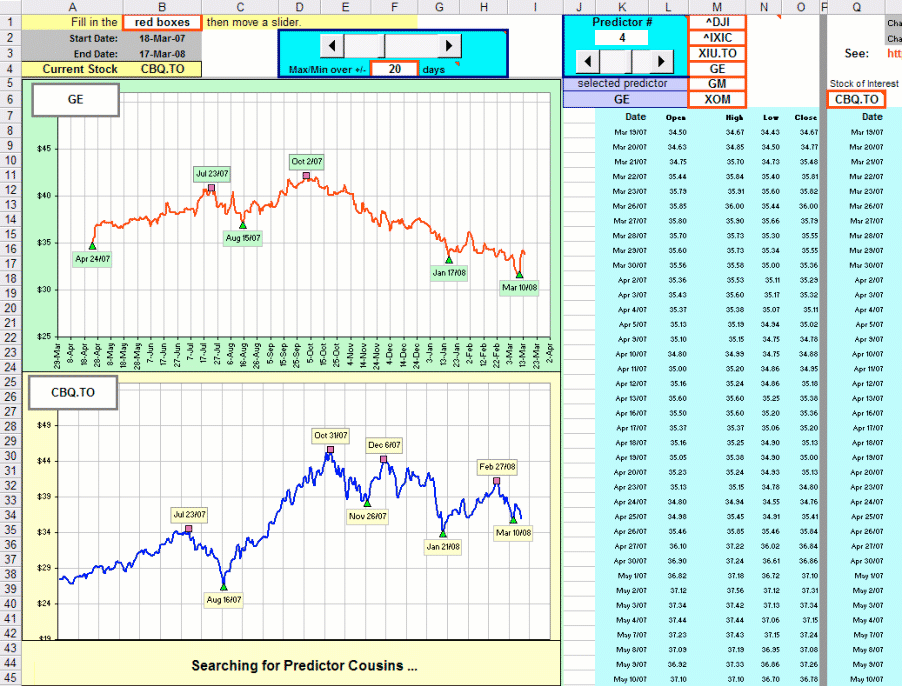
Okay, here's a spreadsheet:

We:
- Pick a stock that we're interested in (Example: CBQ.TO in cell Q6)
- Pick six prospective "cousins" (In cells M1 to M6)
- Move a slider to pick a range of days over which we identify Maximum and Minimum (Example: we're look at Max & Min over 20 days)
>Wait! What does that mean ... looking at Max & Min over 20 days?
We run through all the days and identify those days that have the Maximum price over a 40-day range, from -20 days to +20 days.
For example, on July 23, 2007, GE closed at $40.82 which was the largest closing price from (July 23 - 20 days) to (July 23 + 20 days).
Then we stick the date on the charts.
Finally, we:
- Move another slider to pick one of the six stocks (Example: Stock #4 = GE)
>That's it?
That's it. Click on the picture to download the spreadsheet ... and play. It's great fun! 
