| the Kelly Ratio a continuation of Part I |
We're playing a game: poker, blackjack, the horses, the stock market, the ...
>Okay, okay! I get it ... a game! So?
We start with some bankroll $B0 and, each time we play, we bet a fraction of the bankroll, say x (where x = 0.12 means 12%). We play a hundred times and win n times and lose m times.
>So n + m = 100.
Pay attention.
When we bet x B and win, our bankroll increases by a certain percentage of our bet,
say W (where W = 0.25 means our winnings are 25% of our bet).
>If I double my money, then W = 2, eh?
No, W = 1, meaning my winnings equal my bet. If I bet $20 and get back $40,
then my winnings are $20 so W = 1. On the other hand, if I bet $20 and get back $25, then
my winnings are $5 which is 5/20 = 0.25 so W = 0.25 meaning 25% of my bet (which was $20).
On the other hand, if I bet $20 and got back $45 my bet was $20 and my winnings were $25 so my
winnings were 25/20 = 1.25 and that's W. If my bet was ...
>Wait! In Part I you said W was the amount we won, not the fraction of our bet!
Well, imagine that our bankroll is $1.00 so that if we win $0.65 that makes the fraction AND the amount: W = 0.65, see?
>I think it's ridiculous, but please continue.
Okay. We're talking about winning.
Starting with $B0, we win n times, each time betting a fraction x
of our bankroll and increasing our bankroll by a fraction W of our bet. If our current bankroll were B,
we'd bet x*B and win W times this bet.
>If our bankroll is B, then we bet x*B and win W*x*B, right?
Yes, so our bankroll increases from B to B + W*x*B = B(1+x*W).
| The Gain Factor for a WIN is: 1 + x*W |
When we lose, we lose (perhaps) a different fraction of our bet, say L.
>Wouldn't you lose ALL of your bet ... so L = 1?
Yes, if you were playing blackjack or you were betting on a horse race, but if you put your bet
on some stock then sold at a loss, you might only lose 10% of your bet so L = 0.10 and ...
>Okay, I get it.
Good.
If our bankroll is B and we bet x*B, we'd lose a fraction L of that bet, meaning
we'd lose L*x*B and our new, diminished bankroll, is B - L*x*B = B(1-x*L).
| The Gain Factor for a LOSS is: 1 - x*L |
Remember, each time we win we multiply our bankroll by (1 + x*W) and each time we lose we multiply by (1 - x*L).
|
The Gain Factor for n Wins and m Losses is: G(x) = (1 + x*W)n (1 - x*L)m
and The Gain Factor per trade is: G(x)1/(n+m) = g(x) = (1 + x*W)p (1 - x*L)q where p = n/(n+m) = the probability of a WIN and q = m/(n+m) = 1 - p = the probability of a LOSS. |
|
>Don't tell me! You want the largest value of (1 + x*W)p (1 - x*L)q
>Aha! W=0.20 and L = 0.15 and you win 45 times and lose 55 times
and you should bet x = 25% of your bankroll to get the maximum gain after 100 bets.
| 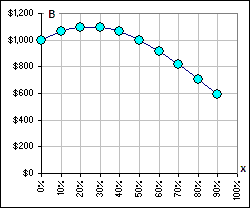 Figure 1 |
>And you'll get the same answer for the "best" x ... as you got in Part I, eh?
Let's see. First we'll ...


If the amount to bet is large, like 50%, you may want to divide the number by 10 or 20 or whatever. That's like choosing a different denominator for the Kelly Ratio ... and some people do!
>So, is Kelly any good?
Let's check it out for a particular stock, starting with a $10K bankroll.
This is what we'll do, after determining the values of p, W and L from
historical data.
- At the start of each week we buy the stock at the opening price for that week, investing x% of our bankroll.
- At the end of the week we sell the stock at the closing price.
- We repeat steps 1 and 2, for a jillion weeks.
- We change the value of x and repeat steps 1, 2 and 3.
- We determine the best value of x and compare with the Kelly Ratio.
>How do you calculate p and W and L?
We look at the past few hundred weeks (for the particular stock we're investigating) and:
- Calculate the percentage of times that the stock increased in price over the week. That's our p.
- We look at all the positive gains (for each week) and find their average. That's our W.
- We look at all the negative gains (for each week) and find their average. That's our L.
>That's confusing. I mean ...
If, for week #k, the return is 1.23% then that gives our Winnings for that week,
as a percentage of our investment,
so W(k) = 0.0123, and if the return were -2.34%, then L(k) = .0234,
and our W and L values are the average
over all k-values of all the W(k) and L(k), see?
>Shouldn't L be negative, 'cause it's a loss and ...?
No. The negative sign is already in the formula:
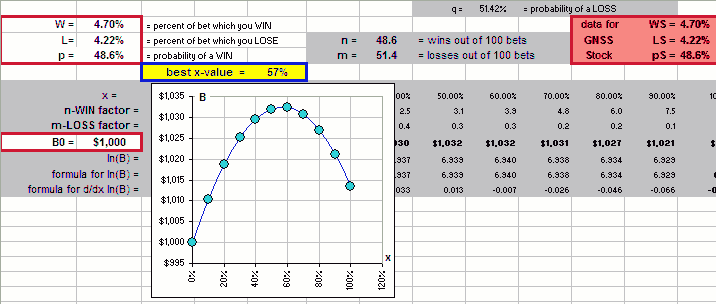
best x-value = { p*W - (1-p)*L }/(W*L)
>So, where are your examples?
Here's a few where we invest, each week, various percentages of our current bankroll.
For x% = 100%, the chart gives the actual performance of the stock.

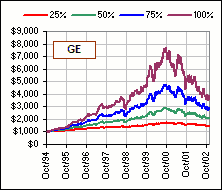

>BUT WHAT'S THE KELLY VALUE !?
All are greater than 100% 
But you'll have noticed that the formula we obtained above is different than the formula we gave in Part I
... and I don't think much of either!
Let's do it differently.
>Do we have to?
Why not? Besides, would you believe anything which says:
Calculate your portfolio growth with a constant x% by assuming>You won't mind if I take a nap?
constant winnings and constant losses and constant winning probability.
 for Part III