|
gummy BEARS: edible ... maybe
|
Here's an interesting chart:

 |
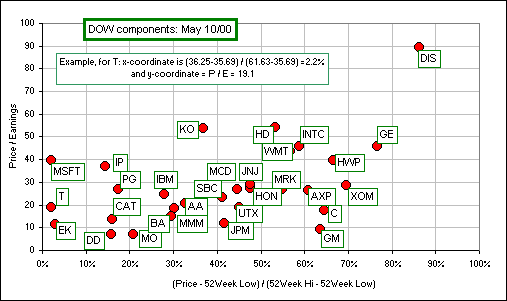
We look at the 52-week Hi and Low for each stock on the DOW and determine where the current
stock price is (here it's on May 10), within this range. For example, AT&T (symbol = T)
was 2.2% above the 52-week Low, within the 52-week range. It's Price/Earnings ratio is 19.1
so we stick a point at (2.2%, 19.1) for T ... and do this for all DOW stocks.
|
Now, if we were Bottom Fishers or Value Investors, looking for a blue chip stock
which has a low Price/Earnings ratio and is near its 52-week low (I guess that's
bottom fishing), we'd gaze at the chart ... and covet those stocks nearest the origin,
eh? Like mebbe:
EK = Eastman Kodak
T = AT & T
DD = Dupont
CAT = Caterpillar
PG = Proctor & Gamble
IP = International Paper
and, would you believe
MSFT = Microsoft Corp
Y'all heard of Dogs o' the DOW?
Now, for Bottom Fishers, I present ...
the DOW gummy BEARS:
EK = Eastman Kodak
T = AT & T
|
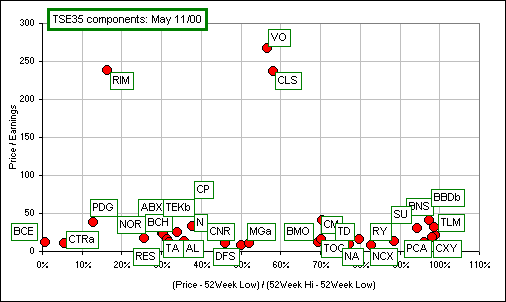
Here's another interesting chart, for the TSE 35 (as of May 11, 2000):

Hence (ignoring BCE which done split in two):
the TSE gummy BEARS:
PDG = Placer Dome
CTRa = Canadian Tire
|

 Need some Hi Techs (suggested by
codee): Need some Hi Techs (suggested by
codee):

Hence:
some HiTech gummy BEARS:
WCOM = WorldCom
MOT = Motorola
|
Keep yer eye on 'em ...
Wanna play? Try this spreadsheet:
gummy-bears.xls
We'd jest luv to see our gummy BEARS recover from a price near their 52-week
low
without significant increase in P/E ratio; that means a move horizontally,
on the chart:
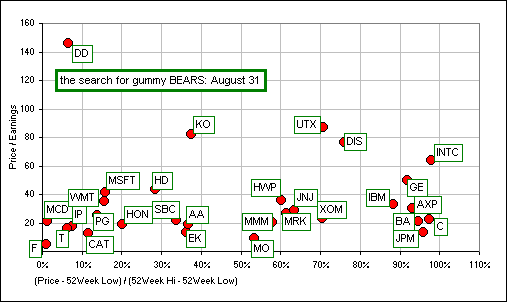
After a few months, how do things look? Compare:


What? Move horizontally?
You might think that, if the price goes up, both x- and y-coordinates will go up, but
EK did it, eh?
Now we gotta wait for T to make its move.
Here's something interesting: if we replace GM with Ford, on the DOW, we get

Year 2000 Hmmm ...
Then, more recently ...

| 


 Need some Hi Techs (suggested by


