| Monte Carlo Simulation |
Here we try to explain how this works ... in more detail:
>It's about time!
- Generate a random annual gain (log-Normally distributed)
using a prescribed Volatility (or Standard Deviation) and a Mean Annual return (for either a single asset/sector ... or several) - Apply this gain to a $1.00 portfolio
and, if there are several assets/sectors involved with a prescribed mix - like 75% stocks and 25% bonds
then rebalance your portfolio after this single year - Withdraw some money (if desired)
like a percentage of the original portfolio, perhaps increasing with inflation - Generate a new random gain for each component and apply it to the current portfolio
- Withdraw some money (if desired) and rebalance
- Repeat steps #4 and #5 30 times (meaning for 30 years!), and keep track of the final value of your portfolio and whether it's less than 10% of your original portfolio, or less than 20%, etc. etc. or (heaven forbid!) whether it's $ZERO!!
- Then, repeat all of steps #1 - #6 a thousand times, keeping track of how often your portfolio went to $ZERO, how often you're left with less than 10% of your original portfolio, how often 20%, etc. etc.
- Generate a chart so everybuddy can see all this stuff graphically.
- Sit back, admire the chart(s), change the parameters (like the years = 30 to years = 40), and do it again!
>But there's a spreadsheet, right?
Yes, you can use a spreadsheet which looks like this:
|
Right-Click the picture and "Save Target" or "Save Link" to download a (draft!) .ZIPd spreadhseet.
>You mispelled spreadsheet. If you need to know what that "Simple or Hypercube?" means, go here.
P.S. If you put Standard Deviation = 0, for both portfolio components, you get a
deterministic chart of a "typical" portfolio, like so
| 
|
| the Math |
- We note that a collection of returns {r} is log-Normal if r = EXP(x) where the collection {x} is Normal.
- If the prescribed Mean and Standard Deviation of the log-Normal
distribution are m and v respectively*,
the associated Normal Mean (M)
and Standard Deviation (V) are obtained via
M = Log(1 + m) - V2 / 2
* Sorry. Here "v" stands for volatility (= standard deviation), not variance :^(
V = SQRT(Log(1 + (v / (1 + m))2)) see the Magic Formula here.
>Sure! Make it confusing!
- The above transformation is done for each portfolio component, yielding Ms, Vs for stocks and Mb, Vb for bonds.
- If there were no correlation between the portfolio components, Normally
distributed gains for
each component could be generated according to the following prescription:
- Pick a number x between 0 and 1.
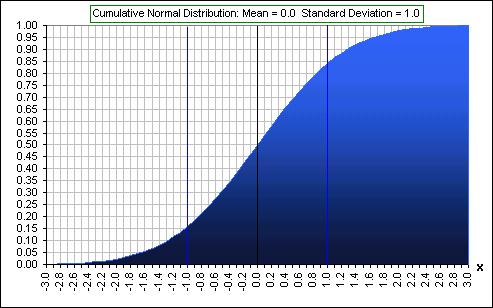
- Determine α where
F(α) = x and F is the
Normal, cumulative probability function
(whose values lie between 0 and 1, eh?) and looks like this:
- Starting at the mean M, go either left or right a distance
αV
where V is the Standard Deviation and α is that random multiplier. - You're now at some Normal gain, M + αV,
so convert to a log-Normal Gain:
Gain = EXP(M + αV ) - 1
where (remember?) α is a number generated according to the scheme described above and
x is a uniformly distributed random number (or probability), between 0 and 1
- Now generate an annual gain for a two-component portfolio according to:
Gain = [ EXP( Ms + α Vs ) - 1 ] P + [ EXP(Mb + βVb ) - 1 ] (1 - P)
where P is the stock fraction.
- However, taking into consideration the prescribed
Correlation(C) between components, an annual portfolio Gain
is generated according to:
Gain = [ EXP( Ms + w Vs ) - 1 ] P + [ EXP(Mb + βVb ) - 1 ] (1 - P)
where α and β are numbers generated according to the scheme described above and (magic!)
w = α SQRT(1 - C2) + βCNote:
If C = 0, w = α, the two gains are independent, eh?
If C = 1, w = β, both gains are above (or below) their respective means, together
hence are positively correlated (meaning stock and bond gains move up or down together).
If C = -1, w = - β, when one gain is above (or below) its means, the other is below (or above)
hence they're negatively correlated (meaning stock and bond gains move in opposite directions).
(See correlation stuff.)>So what's a good value to pick?
Pick some positive (negative?) value (between -1 and +1) if you want the two portfolio components to tend to move up and down together (or in opposite directions?) ... some (but not all) of the time.>Tend to?
Pay attention. - The portfolio is increased by this Gain, a Withdrawal is made
... then increased according to the prescribed inflation Factor(f):Portfolio(n+1) = (1+Gain) Portfolio(n) - Withdrawal(n)
Withdrawal(n+1) = Withdrawal(n) x f - And the above procedure is repeated for n = 1, 2, ... N (meaning for N years), and the final portfolio is noted, after N years.
- All of the above is repeated thousands of times (!), keeping track of how often the portfolio went to $ZERO, how often it's less than 10% of the original portfolio, how often 20%, etc. etc.
If Annualized returns are known for each portfolio component,
they can be converted to
(approximate) Average annual returns via:
(1+Average)2 = (1+Annualized)2 + V2See Average & Annualized stuff.
One other thingy:
|
It's interesting to see the difference between final portfolio survival rates
and the Standard Deviation of the portfolio components. For example, with mean annual returns of 8% and 4% (stocks & bonds) and withdrawals increasing with inflation at 2%, we look into the future with volatilities of 10% and 2% (respectively) then, again, with volatilities just half these, using the above spreadsheet:
Of course, we might also set both Standard Deviations to ZERO
|

|

- And you may want to see the effect of using a Normal (rather than log-Normal) distribution
of annual returns.
- And you might want to peer 30 years into the future using the Mean & Standard
Deviation
from the 1950s or maybe the 1960s or ... like so:
- And what about the probability that your portfolio will last for 5 years or 10 years
or 15 ... like so:

- And what about the variability of your portfolio, how far it might deviate from the
deterministic
component (the red curve)
... as the years progress to 30 years ... like this sample set of "possible" portfolio evolutions:
- Or, stare raptly at this sample chart (below) which shows the growth of a $1.00
Deterministic Portfolio and the
graphs if one adds or subtracts the Standard Deviation (over a thousand Monte Carlo simulations):

>Wow! Just think if you felt satisfied with a Deterministic Gain! How often did the portfolio survive, after thirty years?
For this Monte Carlo run, 20% of the portfolios did not survive.
>It looks like the spread of possible portfolios grows as ...
Yes, as the number of years increases, the distribution of $1.00 portfolios, for example, gets wider ... with more portfolios farther from the Mean Portfolio ... something like this:
- Anyway, you can play with the spreadsheet and extract inofrmation to see the effect of
high inflation, high withdrawal rates, high investment returns ... and high hopes. However, there's
a spreadsheet better suited for Saving for Retirement, described
here.
And you might want to enter a negative withdrawal rate meaning that you're
adding to your portfolio annually ... so you can watch it grow (before you retire
and start withdrawing) 
Y'all kin git enuff info to generate this |
 |

>If you want to scare somebuddy about a 5%
withdrawal rate, pick a
You got it. About 80% of the actual monthly S&P 500 returns lie within one Standard Deviation
from the Mean ... unlike, for example, a Normal distribution where it's 68% and that means ...
>That means you get more returns near the average ... and that's 9%.
For this example and these parameters and this Monte Carlo run and ...
>Yeah, yeah. I know. It's fiction.
Oh ... one other thingy. If, in the spreadsheet, you pick not N or L or S but T, then the spreadsheet selects random TSE 300 returns and Canadian long Bond returns.
 for part II
