Buying Strategies ... maybe 
|
Okay, suppose we're buying stock, say for our retirement portfolio.
We buy every time a paycheck comes in ... maybe monthly.
Each month we buy shares S(1), S(2), ... S(N).
>I assume that S(j) is the number bought in the jth month, right?
Right.
After N months we'd have how many shares?
[1] S(1) + S(2) + ... + S(N) = ΣS(j) = shares held after N months.
If the stock prices each month are P(1), P(2), ... P(N), then how much have we invested after N months?
[2] S(1)P(1) + S(2)P(2) + ... + S(N)P(N) = ΣS(j)P(j) = total amount invested after N months.
Further, how much is our final portfolio worth?
Since [1] gives us the final number of shares we hold and P(N) is the final (or "current") stock price, then:
[3] P(N)ΣS(j) = final portfolio balance after N months.
>Uh ... don't you want the final balance to be greater than what you invested?
Actually, it'd be nice if our final portfolio was much greater than what we had invested.
That means we'd like to have:
|
[4] { P(N)ΣS(j) } / { ΣS(j)P(j) } = { Portfolio Value } / { Amount Invested } >> 1. That >> thingy means "much greater than 1". |
If we rewrite that ratio in [4] we'd get the following requirement:
|
[5] ΣS(j) / { ΣS(j) P(j)/P(N) } = ΣS(j) / ΣS(j)ρ(j) >> 1 ... where ρ(j) = P(j)/P(N) for j = 1, 2, ... N. |
>I'd make all them ρ(j) really small!
It's the ratio of historical, monthly stock prices to the current price ... and, uh ... we have no control over that ratio.
If the stock is really taking off, then P(N) will be much larger than the historical values and ρ(j) would be small and we'd be ecstatic. Alas, we have ...
>Yeah. We have no control. Okay, but what about that S(j) guy?
Yes, what about him? That's how many shares we buy each month ... and that's up to us, eh? 
If we buy the same number of shares each month, say K shares, then S(j) = K for every value of j.
Then we'd have, from [5]:
[6] ΣK / ΣKρ(j) = N / Σρ(j) = P(N) / {(1/N) ΣP(j)} = P(N) / {ARITHMETIC MEAN of historical stock prices}
If we invested the same amount of money each, month, say $K, then we'd be buying S(j) = K / P(j) shares each month.
Using [4] we'd get (since ΣK = N K:
[7] { P(N)ΣK/P(j) } / ΣK = P(N) { (1/N) Σ1/P(j) } = P(N) / {HARMONIC MEAN of historical stock prices}
>Harmonic ... who?
The harmonic mean of umpteen (postive, non-zero) numbers is defined by:
|
If HM = the Harmonic Mean of P1, P2 ... Pn , then
1/HM =(1/n) [ 1/P1 + 1/P2 + ... + 1/Pn ] |
(See, for example, this which compares Arithmetic and Harmonic Means of prices.)
>So [7] is better than [6], right?
Yes.
Buying a constant dollar amount each month is better than buying a constant share amount ... if, by "better", you mean {Portfolio Value} / {Amount Invested} is larger.
>How else would one define "better"?
If I'd like to get a good night's sleep, I might find lower volatility "better".
Maybe I'd like to make monthly withdrawals as well as investments. What then?
Maybe, for me, "better" depends upon the annualized return I get.
Maybe "better" should mean ...
>I like {Portfolio Value} / {Amount Invested}.
Yes, but maybe there are other strategies for generating S(j). We've only considered the two most obvious choices.
Maybe the number of shares should depend upon the volume of trades each month. What do you think about that?
>Uh ... my mind is a blank ...
Okay, suppose the monthly volumes of trades are V(1), V(2), ... V(N) over the past N months ... with V(N) being the most recent, of course.
Suppose, further, that we weight the shares purchased according to the monthly volumes, like so:
[8] S(j) = λV(j) where λ is a parameter.
The total shares held (after N months) would then be:
[9] λV(1) + λV(2) + ... + λV(N) = λΣV(j) = shares held after N months.
The total amount invested (over N months) would then be:
[10] λV(1)P(1) + λV(2)P(2) + ... + λV(N)P(N) = λΣV(j)P(j) = total investment after N months.
The final (or current) value of our portfolio would then be (noting the number of shares we hold, from [9]):
[11] P(N) λΣV(j)
Our magic ratio (a la [5]) is then:
|
[12] P(N) λΣV(j) / λΣV(j)P(j) = ΣV(j) / ΣV(j)ρ(j) ... where ρ(j) = P(j)/P(N) for j = 1, 2, ... N (as before) |
>I notice that, in [6] and [7], you assumed some K-value ... and it disappeared in the ratio. Now you introduce some guy called λ and ...
And it disappears. Neat, eh?
Earlier, it didn't matter whether we bought 1 share or 1000 shares (or $1 or $1000). The magic ratio is unchanged. That makes sense, yes?
Here, it doesn't matter if we buy a number of shares equal to 1% of the monthly volume ... or 10%.
>Don't you mean 0.00001% or 0.0001%?
Uh ... yes, but we can use V(j)/1,000,000 if we like -- just so the numbers don't get too large.
The1,000,000 factor will cancel anyway.
Let's forge ahead: 
Okay, so what we need is a spreadsheet where you define the S(j) and it calculates the magic ratio as per [4] or [5].
The spreadsheet will have variables price and volume so you might want (referring to the three schemes above):
| [1] Shares = 100 | A constant number of shares purchased, namely 100. |
| [b] Shares = 1000/price | A constant dollar amount purchased, namely $1000. |
| [c] Shares = volume/1000000 | Proportional to the monthly volume. |
>What's that "volume" thing again?
That variable will be the monthly volume.
You wait until the end of the month, look at the closing price or monthly volume, then buy your S(j) shares just before the market closes ... at $price.
>And that will do what?
You experiment with various formulas for S(j), find one that works great ... and become a jillionnaire.

You can try, for example:
| Shares = .75*(1000/price) + 0.25*(volume/1000000) | A combination of schemes [b] and [c]. |
Then S(j) might be proportional to 1/price with, perhaps, some other factors thrown in (so it isn't just DCA).
>For example?
| Shares = 0.00001*volume/price | Increases if volume increases or price decreases. |
>Is that the best scheme?
Define "best". 

Click on the picture to download the spreadsheet.
You can enter a formula in cell G2 and another in cell G3.
Both schemes are investigated, with the first compared to the second.
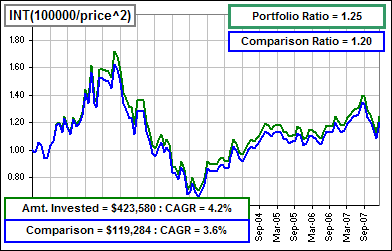
In the example, we're comparing a scheme, where S(j) = 500000/price^3, to the "usual" DCA scheme, where S(j) = 1000/price
(and we take the INTeger part to avoid fractional shares).
We see the monthly purchases and ...
>Wait! You're using 500000/price^3? Are you kidding?
It's for entertainment.
DCA works by buying more shares when price low
(being inversely proportional to price).
So maybe we should try having S(j) inversely proportional to price2 or price3 or ... whatever.
See the lower right chart. DCA (the "comparison" scheme) does buy more when price is low, but
our 500000/price^3 ritual goes above and beyond ... and generates a "better" return.
>So, is that the best scheme?
Define "best".
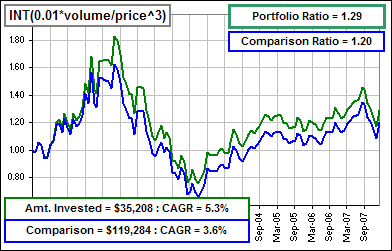
Here are some more ... always comparing to the S(j) = 1000/price DCA scheme:

>Whoa! That last one is LOUSY!
Maybe you haven't noticed, but the time period in earlier examples was 10 years ending in 2008.
That last (lousy) chart covers 10 years ending in 2009. Let's look more closely:
 |
See the stock price chart (upper left)? Mamma mia!
See the share buying chart (lower right)? Mamma mia!
>You're going bananas with your buying ... with them stock prices dropping like a rock, eh?
Looks like it. You might try S(j) = 0.01*volume/price^3 since the volume is going crazy as well as the price.
>So, what's the best scheme?
Define "best".
I wouldn't want to spoil your fun. Download the spreadsheet and play.

| Check out this one
and this one.
But you're not done. Play yourself. They're interesting and fun. |


)
)