| Average True Range |
James Welles Wilder
introduced a number of "Technical Indicators" such as:
Directional Movement Indicator,
Relative Strength Index
and Parabolic SAR and now I find there's yet another that ...
>That you never heard of before.
Well, yes. It's called Average True Range and it goes like this:
| 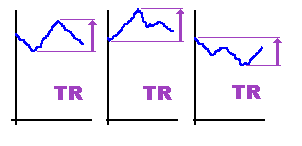 |
Note, too, that ATR is a smoooothing ritual.
>And what does ATR tell you?
Apparently large or small values of ATR may indicate a dramatic price movement or trend reversal.
|
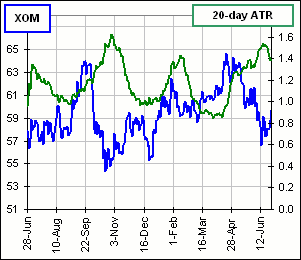
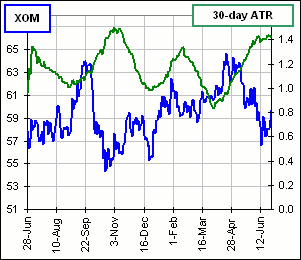
For example, Figure 1 shows the prices of Exxon stock over the period June, 2005 to June, 2006.
The largest value of ATR occurs where there's a significant change in the direction of price movement. >So XOM stops tanking, right?
>And what about the other large values of ATR? What happens there?
| 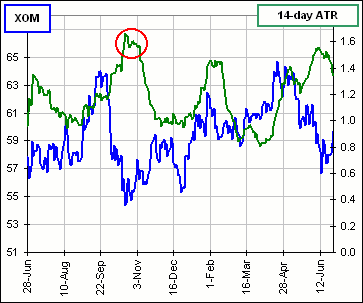 Figure 1 |
>I have an even better way to determine whether the stock prices will change direction.
Yeah, what is it?
>Chart Price versus Date and watch for a change in direction.
Very funny. Of course, we'd have to see if a "large" ATR value will actually predict a change and ...
>And what constitutes a "large" value?
Exactly! If we're talking about $100-dollar stocks there will be plenty of "large" ATR values compared to a $2-dollar stock.
Maybe we should scale the ATR values, eh?
However, before we do that, it seems that using ATR as a dollar value is used by some as a stop loss mechanism.
>Huh?
You'd buy a stock at a price $P and calculate P - 2*ATR and sell if the price fell to that value.
For example, if P = $10 and ATR = $0.65 then P - 2*ATR = 10.00 - 1.30 = 8.70 and that'd be your stop loss.
>My stop loss? I'd say it was yours. Anyway, what's a "large" ATR value?
Okay, here's what we'll do ... divide everything by (yesterday's Close):
- Each day you calculate the largest of the following numbers:
- [ (today's High)- (today's Low)] / (yesterday's Close) ... expressed as a percentage
- | (today's High) / (yesterday's Close) - 1 | ... expressed as a percentage
- | (today's Low) / (yesterday's Close) - 1| ... expressed as a percentage
- Called these numbers Percentage Ranges (or PR).
- You then average these "Percentage Ranges" over the past N days, calling the average the Average Percentage Range (or APR).
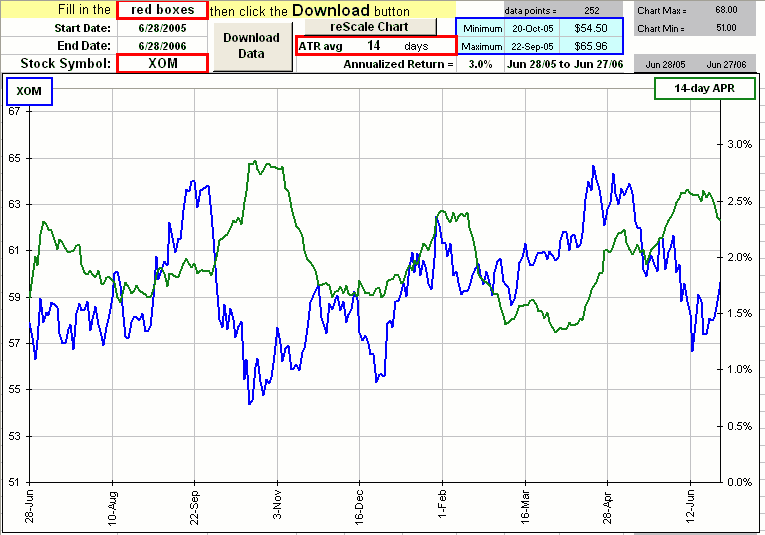
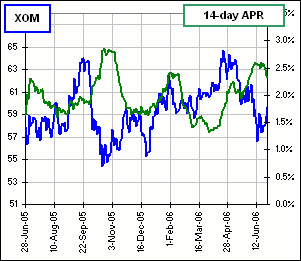
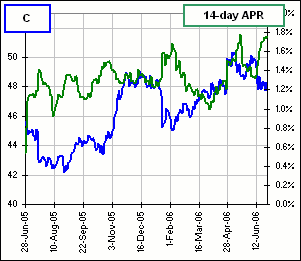
Here are some examples for the period June/05 to June/06:
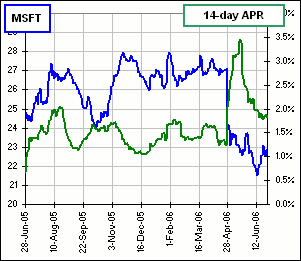
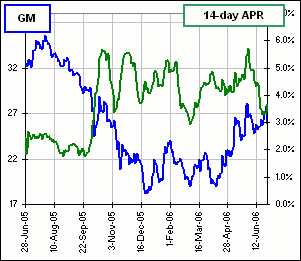
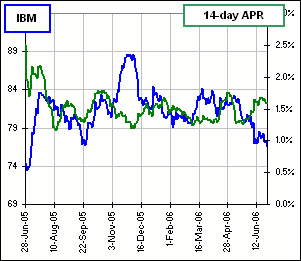
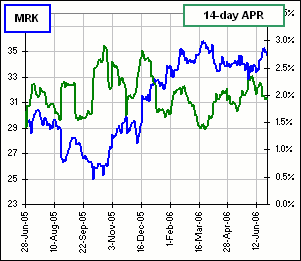
>And your conclusion is ...?
No conclusion ... but it's fun, right?
>Wrong! But it seems you'd look for APRs of at least 3%.
>Okay, where's the spreadsheet?
Click on the picture to download:
>And if I want the reg'lar ATR instead of APR?
There's a button which looks like  so you click the one you want.
I might also mention that Wilder regarded ATR as a proxy for stock Volatility so we could ...
>And is it anything like Volatility?
Yeah, it seems so. For example, here's a couple of charts comparing 14-day APR and Volatility:
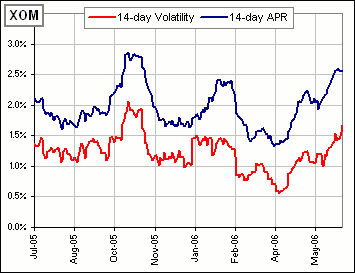
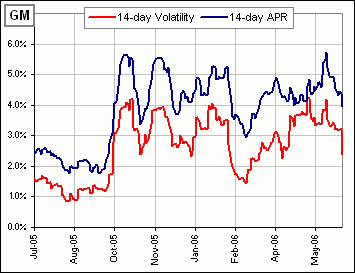
>What about 14-day ATR?
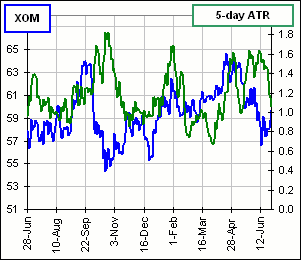
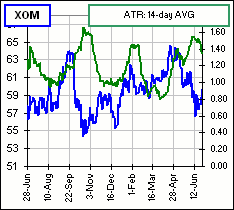
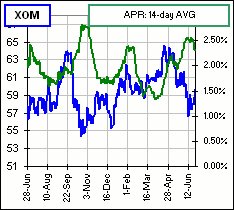
Similar. After all, APR is just a scaled version of ATR. For example, here are two charts comparing ATR and APR :
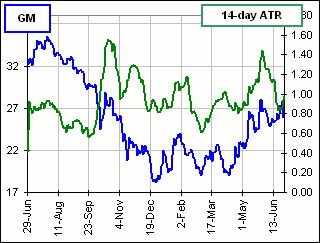
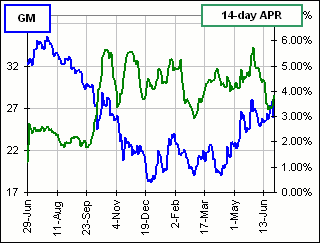
>So I'd say let's stick with Wilder's ATR, okay?
|
I dunno. APR makes me feel warm all over. By the way, there's this stock with an ATR of $35 and ... >Whooeee! Now that is large!
>So I'd say let's stick with APR, okay?
| 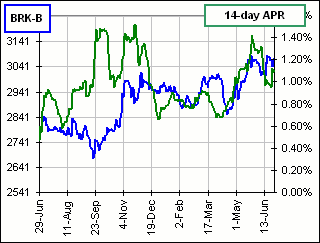 Figure 2 |
|
Oh, I forgot to mention that, although ATR (or, perhaps more appropriately, APR) might stand in for volatility
(that is, standard deviation), if we were to look at the distribution of daily returns, say
for that XOM stock from June, 2005 to June, 2006, and calculate the Mean and Standard Deviation of those returns, then
plot a Normal distribution with that same Mean and Standard Deviation we'd get an approximation to the return distribution as in Figure 3.
Now we do the same, but use the Standard Deviation of the PR values instead (using that Standard Deviation as a stand-in for the actual Standard Deviation). We'd get the magenta curve in Figure 3. | 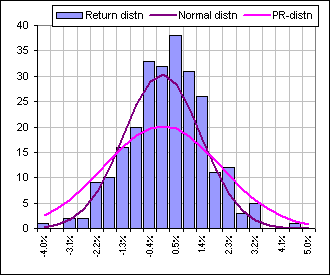 Figure 3 |
>Okay, but is that common, garden-variety average appropriate? I mean ...
I know exactly what you mean, Indeed, I understand that some people (including Wilder?)
use EMA, the Exponential Moving Average, instead, so I ...
>So why isn't that in the spreadsheet?
It is ... now 
In fact, there's a slider that looks like 
So you have a choice of ATR or APR and, for each, a regular Average or an Exponential Average, like so:
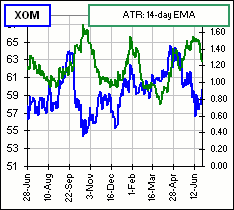
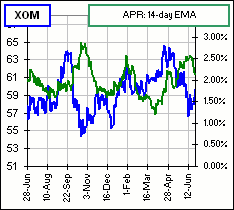
>And which do I choose?
You asking me?


