| ATP: All Time Periods |
Once upon a time I generated a spreadsheet that downloaded prices and calculated the ATP and ...
>Huh?
That's All Time Periods and that stuff I wrote was ancient so ...
>So you decided to bring it up to date, right?
Right.
Now I got a spreadsheet that'll download monthly stock data for the last ten years.
There are about 120 12-month time periods covered by this data. For example:
Jan, 1990 to Jan, 1991 and Feb, 1990 to Feb, 1991 and Mar, 1990 to Mar, 1991 and ...
>Yeah, so?
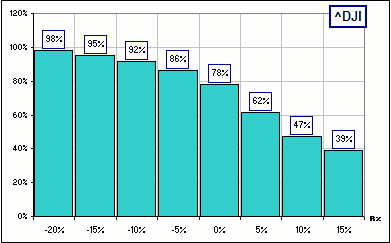
So we can look at all these 12-month returns and calculate the percentage that are less than -15% and less than -10% and less than ...
>Yeah, so?
Then we can repeat this ritual, if we like, using the 60 24-month time periods.
>And calculate how many are less than -15% and less than -10% etc. etc. ?
Well, we'll annualize these 24-month returns, generating an Compound Annual Growth Rate.
We'll do the same thing if you ask for 36-month returns. The equivalent CAGR is calculated.
It answers a question like:
If I were to invest in stock XYZ for 24 months, what are my chances of getting a CAGR greater than 10%?To answer, we could look at all the 24-month returns (annualized) over the last ten years and ...
>Yeah ... so where's the spreadsheet?
It looks like this:
>I click on the picture to download?
Yes.
>And there's a money-back guarantee that it works?
Always. 
>And do you use it ... yourself?
You kidding? To see what'll happen in the future I use this.
Some examples, where we calculate CAGRs using rolling 12-month returns over the past fifteen years (instead of ten):


And where we calculate CAGRs using rolling 24-month returns over the past fifteen years:


