| ADX: Average Directional Movement |
Once upon a time, many years ago ...
>What's your point?
I wrote up something, here (somewhere), on Directional Movement Indicators.
However, though I surfed the Net to find the appropriate calculation ritual, things seemed to have changed and ...
>And it was wrong, right?
Well, it doesn't provide charts that agree with, say stockcharts.com:

Anyway (as suggested by Igal), I decided to follow the procedure in incrediblecharts.com.
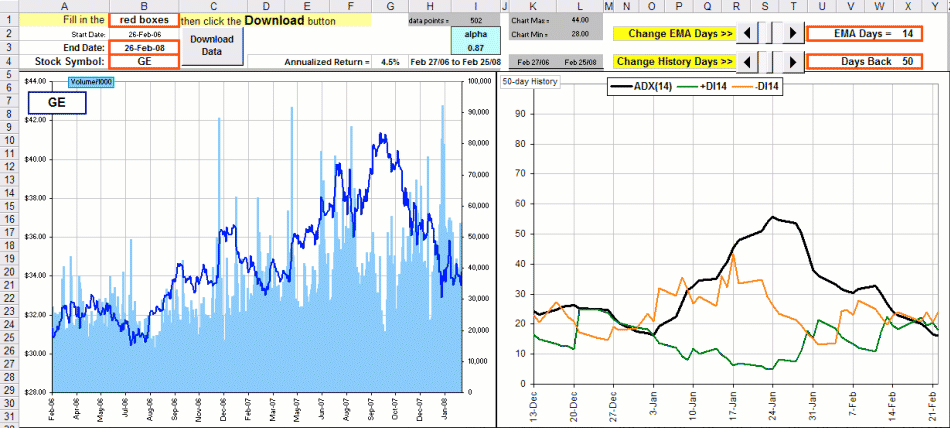
That resulted in a spreadsheet that looks like this:

Click on the picture to download the spreadsheet
>And is it better?
It seems to agree with published charts ... I think. 
Note that, by moving a slider, you can change the days over which the Exponential Moving Average (EMA) is calculated (it's usually 14)
and you can look up to 100 days in the recent past (it's 50 days in the example above).
Click here to see it happen.
>Are you happy now?
Ecstatic. 