| Zweig 4% and other Rules |
The 4% Rule is a market timing system developed by Ned Davis and published in Zweig's Winning on Wall Street, 1986.
It's an attempt to identify a market bottom. The buy and sell signals are based upon the Value Line Composite Geometric Index.
(See this)
For the 30 year period 1965-1995, the 4% rule return gave 13.3% per year while the buy-and-hold return was 3.2% per year.
Although it would normally be used with an index or mutual fund, it's interesting to see how it works with a single stock.
Let me first explain what I understand by Zweig's 4% Rule:
- You compare this Friday's closing price with recent weekly closes.
- If there was a recent low, and this Friday's close is 4% higher than that low, then you assume you're at a market low and you Buy.
- If there was a recent high, and this Friday's close is 4% lower than that high, then you assume you're at a market high and you Sell.
|
>A recent high or low?
Yes. Don't look back too far else you'll miss the bottom ... or top. For example, Figure 1 shows Friday's close for the Nasdaq ... around Christmas, 2002. There was a high on Nov 25 and, two week's later, Friday's price was down 4% from this high ... so we'd Sell.
Then, on Dec 23, Friday's price was at a low and, two weeks later Friday's price had risen above this low by 4% ... so we'd Buy.
| 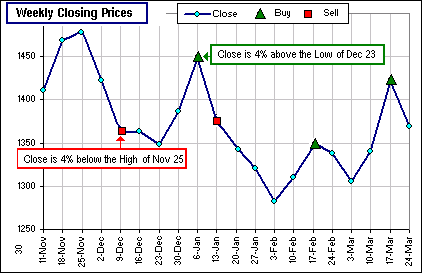 Figure 1 |
>Or maybe that wasn't a good time to apply that rule!
Yes. Investment strategies are sometimes good, sometimes not so good. Of course, one doesn't have to look at weekly closing prices. You could look at daily prices or intraday prices ... or whatever.
>You say that this 4% rule is popularized by this Zweig. Does he do well with it?
Martin Zweig has a mutual fund, the
Zweig Fund (Yahoo symbol: XZFGX). It may (or may not) use the 4% rule but apparently uses a host of economic factors.
Anyway, if you want to pick a market (an index or index fund, perhaps), and you'd like to investigate various values instead of 4%
(comparing to a buy-and-hold strategy), or maybe see what'd happen if you shorted the market or used margin or ...
>Yeah, so?
Then Anthony has a spreadsheet just for you:
Right-click here and Save Target.
>It's not your spreadsheet?
Uh ... no. I actually started to write one but got Zweig's Rule wrong.
As I understand it, Zweig just uses Friday's closing prices, ignoring Monday to Thursday.
My spreadsheet was comparing Friday's close with the daily high and low for the same week.
Further, when the weekly close was 4% lower than the high for the week ...
>You'd Sell, right? You'd identified some kind of market high, right?
Well, no. My spreadsheet actually took that as a Buy.
>Don't tell me! When the close was up 4% from the week's low, you'd ...
Yes. My spreadsheet actually took that as a Sell in my spreadsheet.
|
>Ah yes, the ol' Buy High - Sell Low Rule.
For example, Figure 2 shows the same weeks as in Figure 1 ... except it also shows the highs and lows each week. My screwy spreadsheet would buy when the close was 4% below the high (for the same week), as on Dec 9 ... and it'd sell when it was 4% above the low, as on Jan 6. >Who's rule is that?
| 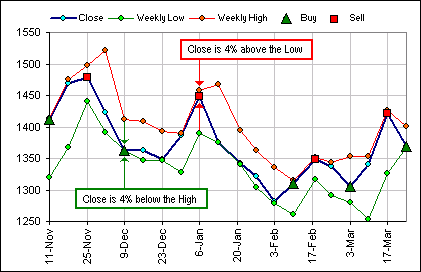 Figure 2 |
|
>I assume there's a spreadsheet?
Uh ... no. When I thought I had finished my spreadsheet I had (using "gummy's rule") a gain of over 200% over the past two years. >Not too shabby! So, why no spreadsheet?
>The following week?
>That's your creeping senility problem, right?
| 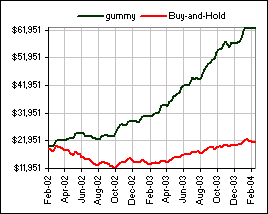 Figure 3 The gummy portfolio had a gain of 205% compared to the DOW gain of 7%. |
Each Friday the spreadsheet looks at five numbers.
| 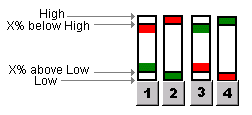 Figure 4 |
No. That was a mistake. It's the weekly High and Low over the previous N weeks ... and you can choose N = 0, 1 or 2.
>N = 0?
That's the current week.
Anyway, you can select 1 of 4 scenarios (via four buttons, as in Figure 4):
- Buy when the Price (that's Friday's closing Price) rises to X% above the Low and Sell when it falls to X% below the High.
- Buy when the Price is within X% of the Low and Sell when it's within X% of the High.
- Buy when the Price falls to X% below the High and Sell when it rises to X% above the Low.
- Buy when the Price is within X% of the High and Sell when it's within X% of the Low.
>Which one is Zweig?
Number 1.
>Which one is gummy's Rule?
Very funny ...
>Yeah. So where's that spreadsheet?
You can download a .ZIP'd spreadsheet (such as it is):
Right-click here and Save Target.
>You say this Zweig strategy is to be used with the Value Line Index?
|
Yes, according to Zweig ... the geometric index: VLIC
>And you sell on a 4% fall from a high and buy on a 4% rise from a weekly low? If that's your pleasure. However, I've changed the spreadsheet so you can choose to sell on a X% fall and buy on a Y% rise. Like Figure 4, but with different values for X and Y ... as in Figure 5 
| 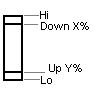 Figure 5 |
|
>Example ... please?
Okay. Take a peek at Figure 6 which shows the Gain over the past two years, using the Value Line (geom) Index and the following parameters:
| 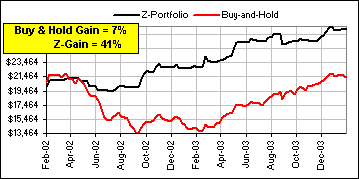 Figure 6 |
|
>What if I have Money Market at 3%, or look at the past TWO weeks, or ...?
Then download the spreadsheet! You've got choices, like so 
In the example we're considering, we're looking only at the current week. | 
|
You got it.
|
>Yeah, but what do I do NOW? What's the current state? Do I buy or ...
Here's the last three months 
You sold two weeks ago, on a Friday. Your money is now all in Money Market. You're waiting for a Buy signal ... and you're up 41% over the last two years. >I'm up 41%? Not likely ... but what about NEXT week?
| 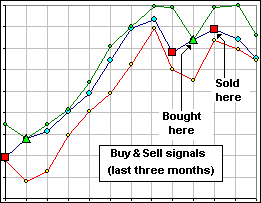 Figure 6A |
|
One interesting thing, for (some) stocks that have really tanked over the last two years
(like Bombardier), you might change a
dramatic loss to a dramatic gain.
>Huh?
>Will that work in the future?
| 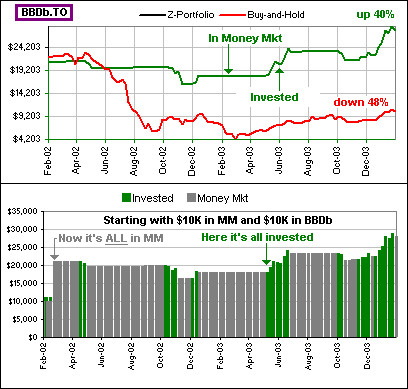 Figure 7 |
>And you're going to consider that now?
No. I've finished with Zweig ... I think.
upDate:
I got email from Tom A. and there's a wee bug in the above spreadsheet when you download daily data and ...

>Aha! I thought so. I knew that ...
Anyway, here's an upDated version: Zweig-2.xls


 Buy
Sell