looking for ... Volatility Smiles 
|
I was talking to my brother-in-law about Call options and he said: "Even volatilty can be volatile".
That got me thinking, so ...
>That was a mistake.
Pay attention!
|
Remember when we talked about selling a Call?
We used the magic Black Scholes formula to estimate the premium: C. That formula requires the Strike price, the Stock price, the Time to expiry, some Risk-free rate ... and some Volatility. In fact, you don't use the standard, garden variety volatility that you'd calculate from historical returns.
|  |
|
>And that's the "Implied Volatility", right?
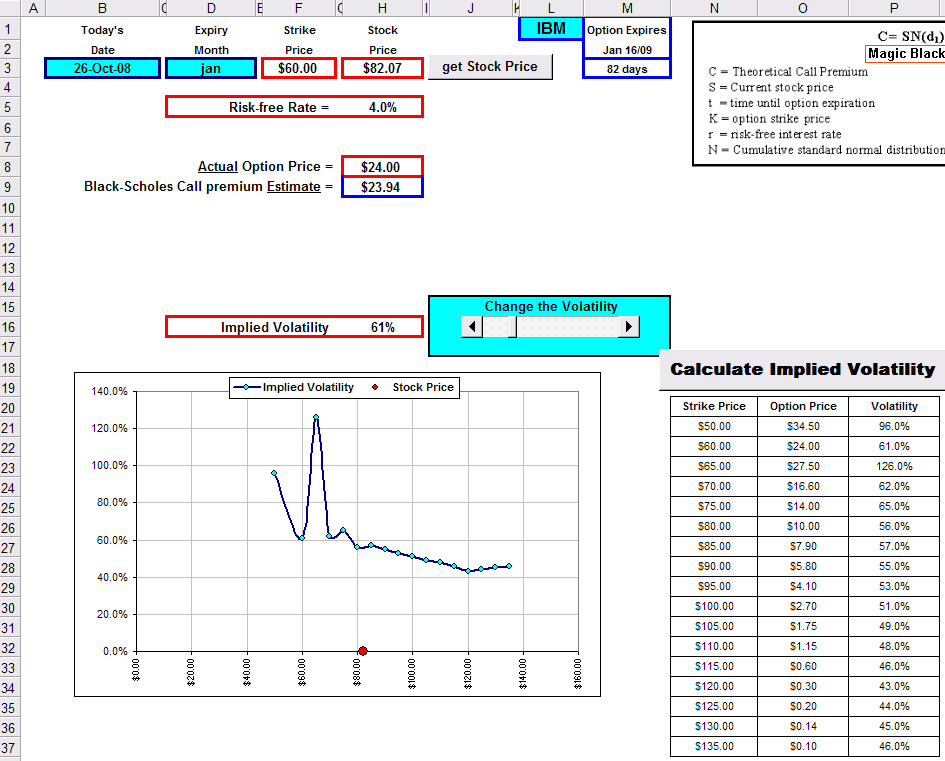
Right! So if you look up IBM, for example, you'd find this: 
The price of IBM stock (at that time) was $82. See the Volatility values needed so that BS would generate a Call price equal to the Actual selling price of the option? |  |
Exactly ... and that's where the Volatility Smile comes in.
I thought it'd be interesting if I could find examples of this "smile" and ...
>Just vary the Strike price in the BS formula.
No. We have to look at actual, real-live Strike prices and, for each, vary the Volatility in BS so we get the actual, real-live Option price.
>Don't tell me! You have a spreadsheet.
What else? It looks like this:
|
>Huh? That's a volatility smile? It looks more like a ...
A volatility grimace. I know! I know! What I'm looking for is some Call option that ... uh ... that ... >That smiles?
|  |
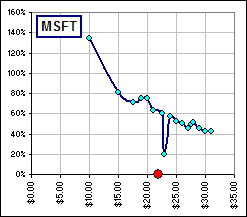
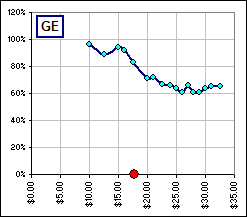
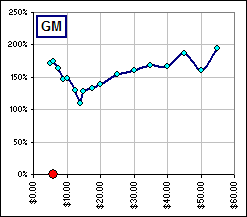
Here are some examples of Implied Volatility versus Strike Price.:

|
>Have you ever found volatilities that have a nice smile?
Yes. The charts above are for options that expire in (about) three months. Here's one that expires in (about) one month: | 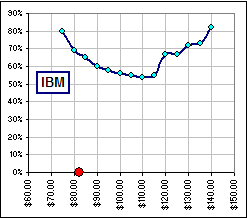 |
>So I click on the picture of the spreadsheet, to download it?
Always.
>And will I know what to do?
There's an Explain sheet, like so:
 |
>Okay, so why would one expect to see a Volatility "smile"?
I have no idea. It's a characteristic of people who buy & sell options.
Normally, to match a larger Strike price, the implied Volatility should go down.
If it goes up, it suggests that option traders are willing to pay more for the option.
In a sense, then, "bumps" in the curve indicate that such an option is in demand, so the actual trading price of the option is larger than "normal", so ...
>So there's a bump in the chart.
Yeah ... I guess. 
