| Turtle Trading |
|
Okay, here's the story (according to a PDF file that Mario sent me):
Note: The very best explanation I've found is here. 
Yes, if I can. |  |
>If Dennis made so much money, why didn't he keep the system a secret?
Apparently, one (or more?) of his students is selling the system, making money without the consent of the originators of the system.
SO, another student has published a description of the original Turtle System.
>So what is this system?
Uh, yes, it goes like this:
- Each day we calculate TR: the True Range. (See ATR)
That's the maximum value of:- (today's High) - (today's Low)
- | (today's High) - (yesterday's Close) |
- | (today's Low) - (yesterday's Close) |
- Then we calculate the 20-day Exponential Moving Average of the TR. (See EMA)
We use the following prescription, calling the result N:
(If it were an ordinary, garden variety moving average rather than an exponential moving average, it might also be called Average True Range.)- N(today) =(19/20) N(yesterday) + (1/20) TR(today)
Note that we need 20 days worth of data in order to begin our calculations.
- N(today) =(19/20) N(yesterday) + (1/20) TR(today)
Yes, but I'm just regurgitating the explanation given in the PDF file ... so don't worry about it.
>Why an exponential average ... and why some True Range thing?
The True Range is a measure of the daily volatility, the price swings over a 24 hour period, the degree of violent behaviour - and we want some moving average smooothing, hence EMA so ...
>Okay! Please continue.
Okay, armed with the value of N, we calculate a Dollar Volatility like so:
- Suppose that a 1 point change in the asset generates a change of $D in the contract.
(D is Dollars per Point.)
- Dollar Volatility = N D
Yeah, that confused me, too.
In the Turtle System, practised by Richard Dennis (and his students), they were trading in futures.
For example, one futures contract for heating oil represents 42,000 gallons. (That's 1000 barrels.)
Then, for heating oil, a $1 change in the price of heating oil would change the price of the contract by $D = $42,000.
Okay, now suppose you have $1M to invest. How much should you invest in the asset with a given Dollar Volatility?
>I give up.
That was a rhetorical question.
The Turtle answer is 1% of your equity per unit of Dollar Volatility.
That is, you build your position in the asset in "Units".
Each unit is 1% of your equity for each unit of Dollar Volatility.
In other words, each Unit is:
Unit = (1% of Portfolio Equity) / (Dollar Volatility)
>That's confusing!
Okay, altogether now:
|
If N = 20-day Exponential Moving Average of the True Range
and $D is the change in the asset for a $1 change in the underlying commodity and Dollar Volatility = N D then Unit = (1% of Portfolio Equity) / (Dollar Volatility) |
Provide an example? Okay, here's an example:
[1]
- Suppose you have $1,000,000 to invest in heating oil futures.
- Assume the Average True Range of heating oil contracts (that's the 20-day EMA of the True Range) is N = 0.015.
- A $1 point change in the price of oil would generate a change in value of the contract of $D = $42,000.
- The Dollar Volatility for heating oil contracts is then: N D = (0.015)(42,000) = 630.
- That makes the size of each trading unit: Unit = (0.01)(1,000,000)/630 = 15.9.
- Rounding, you might buy 16 contracts.
|
>$1M to invest? You kidding? Where would I get that kind of money. I'd be lucky if I had ...
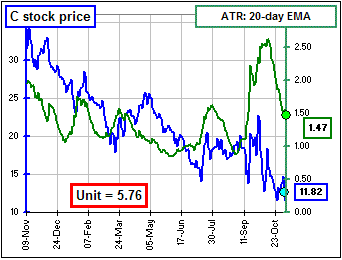
Well, nobody is forcing you to invest in heating oil. You can invest in GE stock with help from the Turtle. Remember that the value of the Unit tells you what fraction of 1% of your equity you should invest in the stock. [2]
| 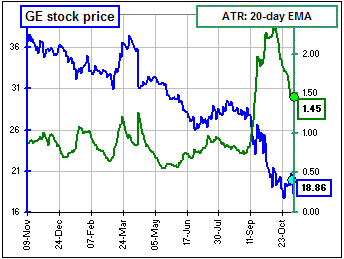 |

You can trade 2 units or 3, but (according to the Turtle Rules) never more than 4. Of course, it's assumed that you have several investments, not just GE.
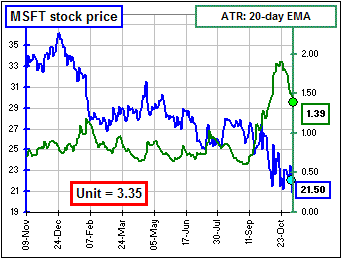
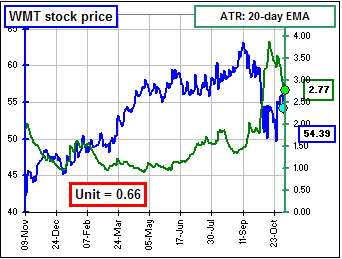
Here are some other examples:
>Where's the spreadsheet.
Patience. We haven't finished describing the Turtle System. There's lots more ... but there's somethng I don't understand. 
| a fly in my Turtle Soup |
- We started with the True Range of prices per share (or per futures contract). That's measured in Dollars per Share.
- We averaged these Dollars per Share over the last 20 days. We got N, which is also measured in Dollars per Share.
If N = 1.25, it means the maximimum daily variation in prices, averaged over 20 days, is $1.25 per share. - Then we introduce $D, the so-called "dollars per point". For our stocks, that'd be measured in Dollars per Share.
- Hence the Dollar Volatility = N D is measured in (gulp!) (Dollars / Share)2.
- Hence our Unit = (1% of Dollars) / (Dollar Volatility) is measured in (Dollars)/(Dollars / Share)2.
That's what I said!
It seems to me that, at least for trading stock shares, the denominator in the Unit ratio should be measured in (Dollars / Share).
Then the Unit ratio would be measured in Shares.
To do this, we'd want N to be a percentage ... like, maybe, (20-day average True Range of prices per share) divided by the (Price per Share).
Then the Unit ratio would be (Dollars) / (Dollars / Share) ... or Shares.
>Sounds good to me.
Yeah, well I'm still thinking. 
In examples I've found, they're talking about commodities.
For example [1], a heating oil contract in March, 2003 was trading at about $0.60 dollars per contract and the average True Range was about 0.015 dollars per contract, as we noted above.
(That's the example in the PDF paper I mentioned earlier. It's saying that the 20-day average of "price variations" was $0.015 per contract)
Then the Unit ratio would be (Dollars) / (Dollars / Contract)2 and that ain't right.
Indeed, that PDF paper says that the Unit ratio is in "contracts".
>I think you're confused.
Hmmm ... yes. I guess I'd better work on that spreadsheet ... 
| a Spreadsheet ... maybe (?) |
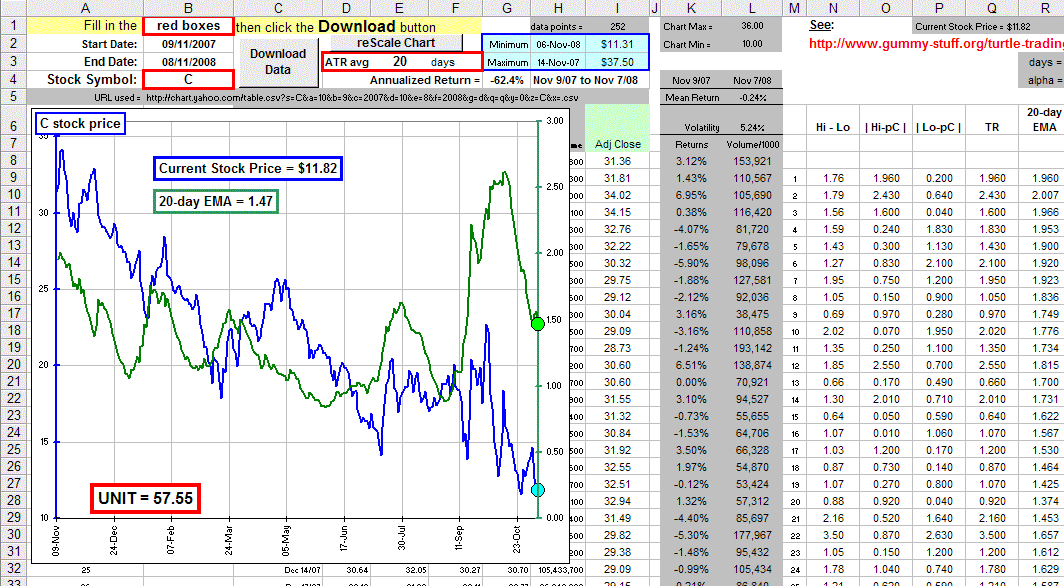
Okay, here's my spreadsheet ... so far. Click on the picture to download the speadsheet.
Following the "typical" Turtle System, we take the m-day EMA using the magic formula:
N(today) =(1 - 1/m) N(yesterday)+ (1/m)TR(today) .
That's give weights 1 - 1/m = (19/20) and 1/m = (1/20) for m = 20.
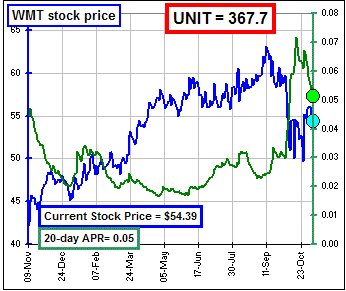
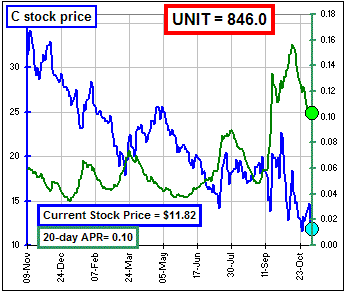
Until further notice (!), the Unit ratio is based upon $100K equity (so 1% = $1K).
Hence Unit = $1000/[N*(Current Price)].
In the spreadsheet example, that'd be: 1000/[1.47*11.82] = 57.55.
>Is that 57.55 shares ... or what?
I'm still cogitating ...
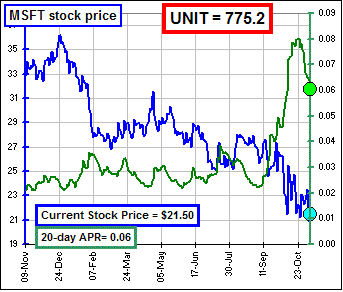
I think it's reasonable to modify the above spreadsheet so that I calculate the 20-day APR rather than the 20-day ATR.
>APR?
Don't you remember? We talked about that here.
That's the 20-day Average Percentage Range where the Percentage Range is defined like so:
- Each day you calculate the largest of the following numbers:
- [ (today's High)- (today's Low) ] / (yesterday's Close)
- | (today's High) / (yesterday's Close) - 1 |
- | (today's Low) / (yesterday's Close) - 1|
- Called these numbers Percentage Ranges (or PR).
- You then average these "Percentage Ranges" over the past m days, calling it the Average Percentage Range (or APR).
Then we're happy.
>We are happy? You mean you are happy!
Yes. In fact, you now have a choice in the spreadsheet. In fact, you got one of these:
>Does that make a difference?
Yes. Here are the examples we did above:
>And UNIT gives the number of Shares your should trade?
Yes.
>When?
Aah, very good question, however, lets' compare the logic behind the two schemes, assuming that (1% of Equity) = $100K:
UNIT = (1% of Equity)/[ (ATR)*(Stock Price) ]
|
UNIT = (1% of Equity)/[ (APR)*(Stock Price) ]
|
 Click to continue to Part II.
>WAIT!
Cost = almost infinite! You kidding?
Yes, it's true. Dividing by APR, a percentage, we'd get a HUGE value for our UNIT.
But we'll fix that by dividing by 100*APR. Then, if APR = 2.5%, we'll just divide by 2.5.
In the above example, the APR UNIT would then by 2000/2.5 = 800 shares at a cost of $50*800 = $40K.