| Growth versus Value and Slice and Dice |
First, let's try to explain the difference between Growth and Value stocks.
Growth stocks tend to have Price/Earnings ratios greater than average, tend to be over-priced with higher price-to-book ratios ... but there's an expectation of dramatic future earnings growth.
>That's why people invest in them?
Yes. It's the rosy future that investors see. On the other hand,
Value stocks tend to be cheap with P/E Ratios smaller than
average, out of favour stocks with (perhaps) greater-than-normal dividend yields and little
or no sales growth ...
>Why on earth would investors ...?
They see under-priced, overlooked stocks with great future potential.
|
>You're kidding, right? Stocks that'll tank and ...? >Barra? How do they identify ...? The value index contains firms with higher book-to-price ratios; conversely, the growth index has firms with lower book-to-price ratios ... >I don't think I'd like Value stocks ... Take a look: >Whooeee! I like Value! >That means ... what? >Okay, I get it. >So that gain is maximized? |
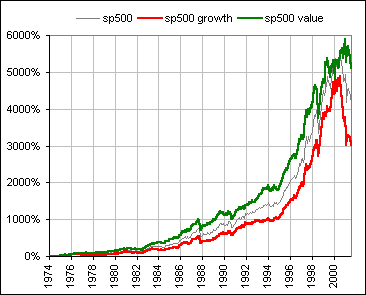 Fig. 1
 Fig. 2 |
|
>Risk minimized? How'd you define Risk? Is it ...? >Please! Not that! Each year we calculate the Mean Annual Return and the Standard Deviation over the previous N years and compute
and call it Risk. For Fig. 2a, N = 10 >That formula for risk ... is it ...? |
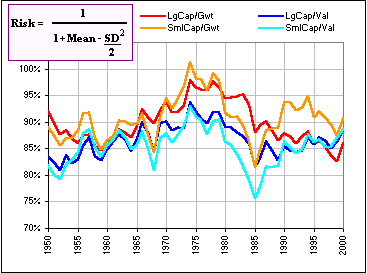 Fig. 2a |
>So, what's this Slice and Dice stuff?
One chooses equal parts Growth and
Value and ...
>Sounds like a recipe. Slice and dice onions and mix equal parts ...
Pay attention. We consider four asset classes.
Large Cap Growth, Large Cap Value, Small Cap Growth, Small Cap Value.
We invest 25% in each and rebalance our portolio to maintain this 25% figure. If we use the
Barra Indices we get the following:
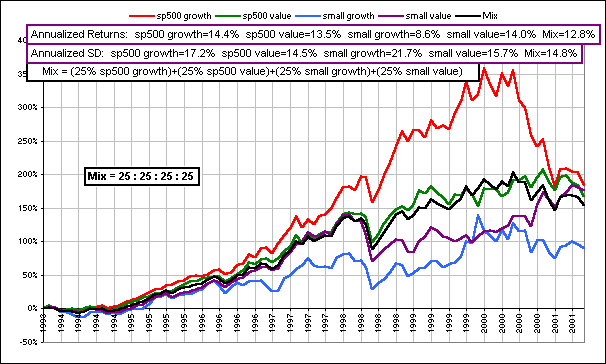
Fig. 3
>Wait! Value should be better than Growth, according to your earlier chart! >Why not go back to 1975?
I'm interested in the question:
>If that's the question, then what's the answer? >Wake me up when you're finished.
>zzzZZZ
Look! I found some
Fama & French
data back to prehistoric times:
The chart gives the annualized returns as well as the Volatility (or Standard Deviation) and ...
>zzzZZZ Look! It's slice&dice (Fig. 6) versus cut&chop (Fig. 7):
>Huh?
Surprise! I said that sometimes Growth is better, sometimes
Value, depending upon the time period. The above chart is
for the period since 1994 and look at Fig. 2 to see whose been winning since ...
These four Barra indexes are available only back to 1994. In any case, I'm not interested in
the case
25% in each of 4 asset classes, often called
4 x 25 or
the Coward's Portfolio
(a term coined by Bernstein who said:
"... if history is any guide, a portfolio divided equally among these four assets will most likely outperform
the overwhelming majority of investment professionals over the next few decades.").
I have no idea ... but let's cogitate on it.
If we were interested in minimizing the Volatility (or Standard Deviation), then we can do better
(at least for that particular time period) by choosing something other than
4 x 25.
For example, here we get a Standard Deviation of 14.4% for a different mix: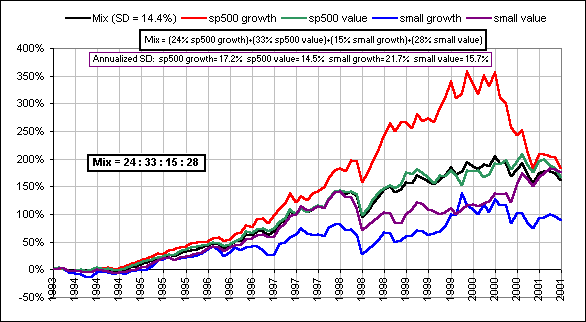
Fig. 4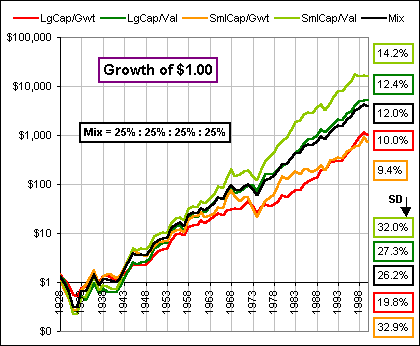
Fig. 5
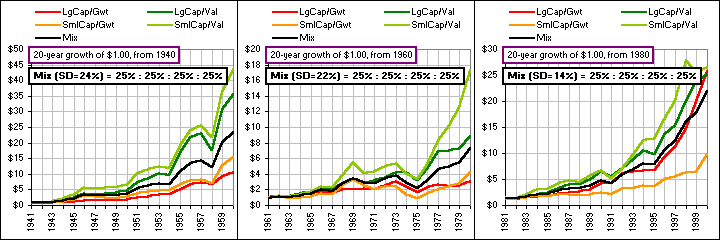
Fig. 6
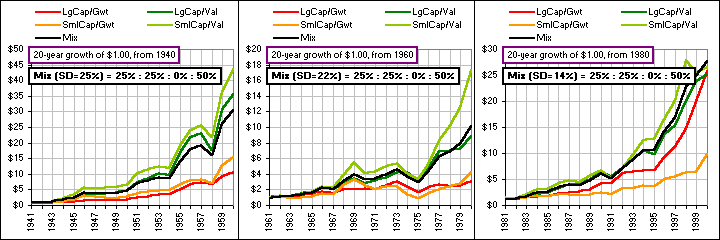
Fig. 7
If we consider the period 1950 to 2000 (that's 51 years), and use the Mean Annual Returns
and Standard Deviations for just LargeCap Growth and Value, and SmallCap Value ...
|
>What happened to SmallCap Growth? >And the others?
LargeCap Growth 17.0% Anyway, we can generate a Frontier which gives us the fractions of each asset class which minimizes the Standard Deviation of our portfolio ... >Did you say Frontier? |
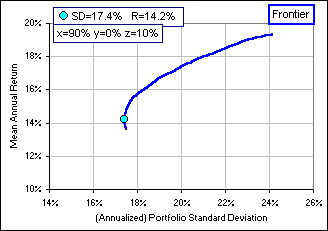 Fig. 8
|
>No Large Cap Value? Why not?
T'ain't me who says that, it's the spreadsheet which does the calculations. Of course, we may
be more interested in minimizing the Risk rather than the
Volatility ...
>How do you define "Risk"? Isn't it the same as ...?
>Picture? >Okay! I get the idea. So? >Are you going to give me a picture ... or not? >What's all that other stuff? >Is there a spreadsheet for this stuff?
Volatility? Not to most people. However, there are plenty of definitions of risk. For example,
we might say "If my annualized return is less than 5%, that's risky
... hardly keeping up with inflation."
Okay, suppose we consider all the 30-year periods starting in January, 1940 and running for 30 years,
then starting in February, 1940 and running for 30 years, then starting in March ...
So we pick one of these 30-year periods at random (meaning we pick the starting month at random)
and compute an annualized portfolio return,
assuming we had invested in Small Cap Value or Large Cap Growth etc.. We see if this annualized
return was less than 5%. Then we do it again a thousand times, picking a
random year and running out for 30 years. The percentage of these 1000 simulations which gave
a return of less than 5% is charted as well as ...
Here's a picture.

It also gives the percentage of simulations which gave an annualized return greater than 10%. It
also gives the survival rate for a portfolio where you withdraw 4% of your original portfolio,
annually, and this amount increases with inflation.
>What inflation?
The inflation (actually the increase in Consumer Price Index) for the year which was chosen at random.
>Are you saying that, had I invested in Small Cap Value,
that it had absolutely no 30-year period where I'd have made less than 5%?
That 0.0% of the simulations had a return less than ...?
Remember, this is Monte Carlo, not reality. What'd happen in the future is unknown.
However, I think that Small Cap Value is getting a bum rap as the riskiest asset class just
because its Standard Deviation is large ...
Yes.
See Sensible Withdrawals where it describes
a spreadsheet which looks like
this.
The spreadsheet has a component which is explained like
this.
 for Part II
)
)