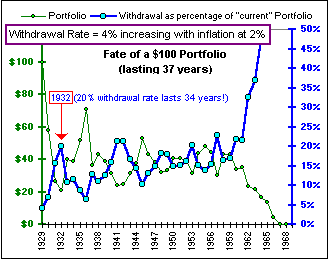
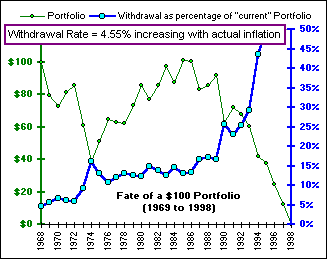
| Maximum Withdrawals Part II ... a continuation of Part I |
It's 1970 ... and we're retiring.
We look back at the past thirty years, since 1940. That's the period 1940 to 1969.
We use the Mean Return and Standard Deviation for, say, the S&P 500 and use Monte Carlo
to find a Safe Withdrawal Rate.
>Safe? What's safe?
We run a thousand Monte Carlo simulations, using that Mean and Standard Deviation, and see what
withdrawal rate ...
>Please. In more detail.
Okay.
- We pretend that we start in 1940 with a portfolio, say, $100,000 invested in the S&P 500 and withdraw, say 4% or $4,000.
- Each year we'll increase the amount withdrawn by the average inflation for that thirty year period, namely 3.58%.
- We use the Mean and Standard Deviation for thirty years (1940 - 1969, namely Mean = 13.27%
and Standard Deviation = 17.04%) to generate a return for the coming year (assuming a Normal Distribution of returns). - After doing this for thirty years we repeat the whole process a thousand times, choosing random returns from a Normal Distribution with the specified Mean and Standard Deviation (obtained from the return data from 1940 to 1969).
- We keep track of how often our portfolio survived, after thirty years.
- We vary the withdrawal rate until 95% (or more) of the portfolios survive the thirty year Monte Carlo simulation.
>By 95% you mean 950 of those thousand simulations, right?
Right. The result is:
| Normal Distribution: 4.2% is "safe", with 95% (or more) of the Portfolios surviving. |
>So? Does that surprise you?
Pay attention. Now we'll repeat the above steps, but we'll assume a Log-normal distribution.
>Instead of Normal, right?
Yes. The result is:
| Log-normal Distribution: 4.6% is "safe", with 95% (or more) of the Portfolios surviving. |
It's higher because, for Log-normal, the Return Distribution is more scrunched up around the Mean ... and the Mean of 13.27% is pretty high.
>Scrunched?
Pay attention. Now, we use the actual S&P Returns as follows:
We choose a year at random (from 1940 to 1969), then select the actual S&P 500 return
and the actual inflation for that year. We use this random selection to generate a year's
growth and withdrawal for our Portfolio ... and we repeat this for thirty years. Then we do
the whole thing again a thousand times and count the number of times our Portfolio survives.
>What about the Withdrawal Rate?
Oh, I forgot. We start with, say, 4% and increase it until we have a 95% Success Rate.
>Success Rate, meaning the Portfolio didn't go to $0 after thirty years.
Right. The result is:
| Actual Return Distribution: 4.9% is "safe", with 95% (or more) of the Portfolios surviving. |
>Finished?
Nope. Now we just use the thirty years from 1940 to 1970, exactly as they happened, no random
selection, just the actual annual gains and inflation rate and ...
>Don't tell me! You're finally going to use that
Magic Formula from
Part I
Right! It gives the Withdrawal Rate that would decrease your Portfolio to $0 after thirty years, from
1940 to the start of 1970.
The result is:
| Returns as they Occurred: With a 7.3% Withdrawal Rate, Portfolio would have lasted thirty years. |
>Lovely! I'll take it!
You're missing the point. It's 1970, remember? Now, after all that analysis on the previous thirty
years, what Withdrawal Rate do you choose for the next thirty?
>I'll take 7.3%!
|
Hmmm ... I think you're dreaming, but let's see what would have happened from 1970 to the start of 2000, the
start of a new millenium.
>The new millenium started in 2001. >Have I mentioned that you don't have a single picture ... | 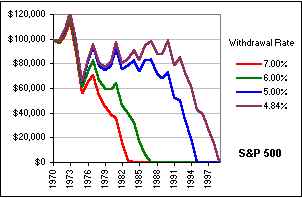 Fig. 1 |
>So what are you suggesting?
Me? Suggest? Heavens, no! I use my own
Special Patented Technique.
>Then what's the purpose of this tutorial?
Oh, that!
Well ... I'm suggesting (among other things - see below) Sensible Withdrawals. A fixed 4.5% would have done okay over
the past thirty years, but if 3% pays the bills, then 3% + 20% of the 'extras' would have done
much better. After all, it doesn't ignore the market, does it?
|
>That's
DMC, right? >Picture? We pick a random year, from 1970 to 1999, and select the annual gains for that year, and a sequence of actual, historical inflation rates, and apply them to a 4 x 25 slice and dice Portfolio, repeat for forty years, then do it all over again a thousand times to see how we did with a 3% Withdrawal Rate and 20% of those lovely 'extras' and find that, instead of a fixed annual income of $40K in today's dollars (that's the fixed 4% withdrawal route) we can expect a greater survival rate and an income significantly greater in the early years of our retirement and less in those later years ... | 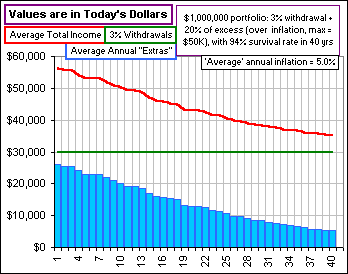 Fig. 2 |
>Expect? Did you say expect? You mean it's not guaranteed?
Guaranteed? Did you say guaranteed? What's guaranteed, these days?
We're doing the Monte Carlo thing. We do random selections and average over a
jillion trials and identify a 95% success rate. Whether the future looks anything like these
random selections or whether the future is one of the failing 5% ... who knows?
It's a slot machine with a 95% payback. You can lose.
It's a race track with a hundred horses and you bet on 95 of 'em. You could lose.
It's a ...
>Yeah, yeah! Let's not go melodramatic. I get the idea.
Good. The point is we should be flexible, change our tack as market conditions change.
If need be, we do without that trip to Greece or Tahiti or ...
|
>Or Toronto? Go back to sleep. >zzzZZZ Uh ... one last thing: If we choose a fixed 4% Withdrawal Rate - because it's Safe - then with our 4 x 25 Portfolio over the thirty year period 1970 to 1999, a $500,000 Portfolio would grow to over $6,000,000, on average, over a thousand Monte Carlo ... >I see we're back to Monte Carlo again. Pay attention. Here's a picture of some sample Portfolios over 30 years. The thin red graph is the Average of a thousand such Portfolios. | 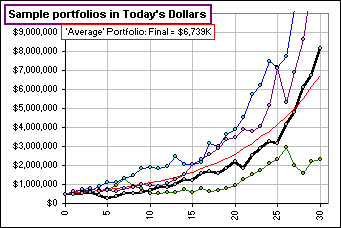 Fig. 3 |
>And what about the real, live, actual Portfolio, assuming ...
Assuming a fixed 4% Withdrawal Rate, increasing with the actual inflation? None of that random selection stuff? Just the actual returns in the order in which they ...?
>Please!
Okay. It's the black curve, in Figure 3.
>Wow! It's huge. I mean, we start with $500K and end up with $8M. So, why are we talking 4% Withdrawal Rate?
If you're saving for retirement then figure how much you'll need to live comfortably, say it's $40K, then assume you need a Portfolio large enough so that 4% withdrawal gives you your $40K ... that means you multiply your $40K by 25 and that gives you $1 million, so you strive for a $1M Portfolio.
>All numbers increase with inflation, eh?
Yes.
>And once you're retired and have achieved that Portfolio, what about that 4% Safe Withdrawal?
Fagedabawdit.
>But if you plan on 4%, couldn't you get that with bond coupons, stock dividends, money market interest ...?
Maybe, maybe not. That's Yield Investing and suits some investors. If 4% is "Safe" from portfolio yield alone - then one can almost ignore the market volatility, laugh at bear markets, sleep well at night ...
>So, how much could we have actually withdrawn, starting, say, in 1965, and going for thirty years and ...?
And assuming a 4 x 25 Portfolio and our withdrawals increase with inflation ...
>Hold on! You keep saying "Increase with inflation", but what if inflation decreases?
Then we withdraw less. Anyway, using that Magic Formula (from Part I), we get the following where our Portfolio would have lasted for umpteen years, starting in the indicated year:
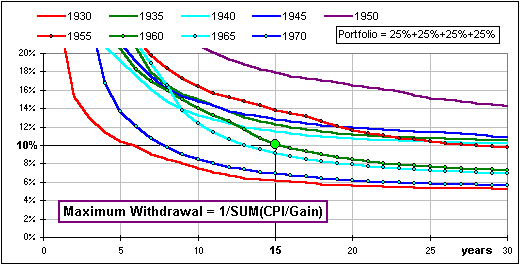
Fig. 4
Note that, starting in 1960 (for example) we could have withdrawn about 10% and our Portfolio
would have lasted for 15 years. See the big green dot?
>So that gives the Maximum Withdrawal Rate, eh?
Right.
>You like this 4 x 25 stuff, eh? I mean, 25% each of Large Cap Growth and Value and 25% of Small ...
It's just an example - and I don't particularly like it.
Here's another allocation more to my liking, although, unless otherwise specified, we'll talk about 4 x 25:
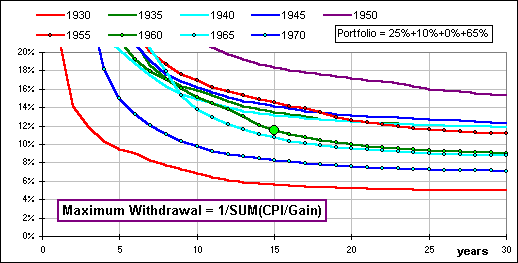
Fig. 5
Okay, to make it clear we'll do it this way:
>And what about that 4% Safe Withdrawal?
Fagedabawdit.
>And what about the Trinity Study and ...?
Fagedabawdit.
>Well, it does seem there's been lots of "extras" in the past ... over and above that 4%.
Yes. Here's a picture of the extra Withdrawal Rates, as a percentage of the original Portfolio,
starting in a particular year and running for thirty years:
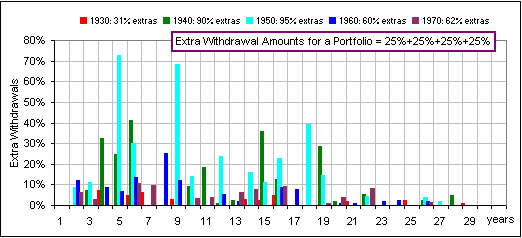
Fig. 6
>I don't understand the chart. Does it mean that ...?
It means that, for the thirty years starting in 1960 (for example - see
the blue columns?),
you could withdraw 4% of the original Portfolio, increasing (or decreasing) with inflation, and
in addition, if your Portfolio increased that year (after the withdrawal) by at least
the inflation rate, you could withdraw another 60% of those "extras" ...
>"Extras", meaning the excess, above inflation.
Yes, except that if the inflation rate was negative ... that happens, sometimes  ... then you use 0% as the inflation rate for that year, in order to calculate those "Extras".
>Uh ... does that mean ... uh ...?
If we start the year with a Portfolio worth $P(n) then, at the end of the year our Portfolio is
worth:
P(n+1) = P(n)*(1+AnnualGain) - Withdrawal
where Withdrawal is a percentage of the original portfolio (way back when we started
withdrawing), but the withdrawal amount increases (or decreases!) yearly with inflation for that year.
|
If the P(n+1) exceeds P(n) by an amount $A which is greater than the Maximum of (Inflation Rate)*P(n) and $0 then a Percentage of $A is also withdrawn. >And how much of $A you get ... them's the "Extras", eh? >You're doing the Monte Carlo thing again! | 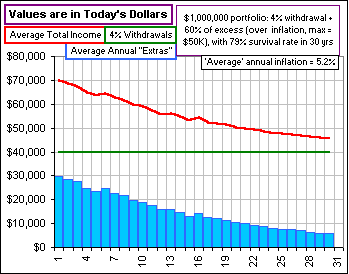 Fig. 7 |
Yes. That's for the Monte Carlo Random Year Selection technique. For the actual sequence of Gains and Inflation rates, our Portfolio would have lasted the thirty years ... guaranteed.
>Guaranteed? Nothing is guaranteed.
We were talking of the past. We know the past. Now, for the future I'd use ...
>Don't tell me! Your Special Patented Technique.
Aha! You're one smart fellow!
>Aw ... shucks.
|
Remember when I said (in
Part I)
that the Maximum Withdrawal rate is
>What curve? A curve like this, for example:  It's a plot of the CPI/(Cumulative Gain), starting in 1950, assuming CPI = 1 at the beginning of 1950. Notice that most of the area is near the beginning of the time period ... in this case (which starts in 1950), most of the area is in the first ten or twenty years. | 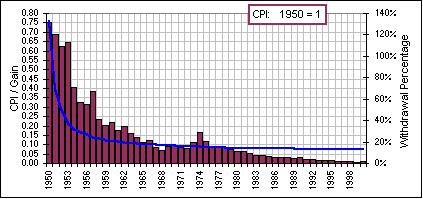 Fig. 8 |
>What's that blue curve?
That's the reciprocal were talking about ... 1/(Area under the Curve), from 1950 to 1951, 1952, 1953, etc.
>But it starts at over 130% !! Are you saying a Safe Withdrawal is 130%?
I'm saying that if you wanted your Portfolio to last just 1 year, you could withdraw 130%, because 1950 was a fantastic year with market gains of 40%. If you wanted your Portfolio to last for ten years, you could have withdrawn 20%. Uh ... did I mention that we're talking about a 4 x 25 Portfolio?
>Okay, but I never know what you're trying to prove.
I'm not trying to prove anything. I just wanted to point out some things about
the Withdrawal Rate that reduces your Portfolio to $0, as opposed to the Withdrawal Rate that
gives you a 95% Monte Carlo probability of survival.
>Monte Carlo probability?
Yes. The probability that 95% of the Monte Carlo simulations ...
>Okay, I get it. It's the Count of Monte Carlo, eh?
Very funny, but ...
>But what are the things I'm supposed to see
... about Withdrawal Rates that reduce my Portfolio to zero?
You're supposed to recognize that if (for example) over 95% of Monte Carlo simulations result
in a surviving Portfolio with a 4% Withdrawal Rate, then there's gotta be a lot of
those surviving Portfolios where you could have withdrawn more ... maybe 6% or 10%
or 20%. Each of
the thousand simulations has a 30- or 40-year sequence of Gains and Inflation rates and each
sequence has a Maximum Rate of Withdrawal which would have reduced your Portfolio to $ZERO. That'd
be the Maximum Rate. More than that and your Portfolio would be ...
>You keep saying MY Portfolio. It's not MINE, it's ...
Pay attention:
We'll call that Withdrawal Rate - the one that reduces your Portfolio to $0 in N years - let's call it the Maximum Rate of Withdrawal, or MRW(N). Here are some of its features:
For a 4 x 25 Portfolio and 30 years:
Yes, if you had started in 1932 when the market was recovering from the crash - with a vengeance! In 1933 the S&P 500 increased by over 50% and Small Cap Value increased by over 100%. Further, inflation rates were negative for a few years (so withdrawals, which we assume change with inflation, actually decreased). | 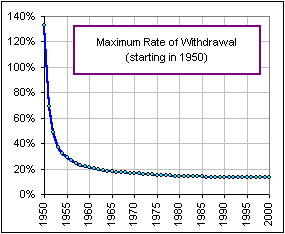 Fig. 9 |
|
>Well, those bad days, like 1929, they're gone forever, eh? Actually, starting in 1969, MRW(30) = 4.6% so you could withdraw only 4.6% (changing with inflation) in order for your Portfolio to last 30 years. It was the harbinger of the bear market in the seventies and for the next ten years inflation averaged close to 7% so withdrawals tied to inflation increased rapidly while your Portfolio decreased rapidly. >You say "the Minimum of the Maximum". I find that confusing. | 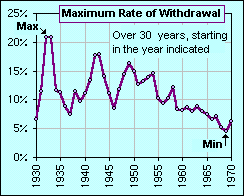 Fig. 10 |
There's a spreadsheet that'll do all this.
We've seen it before, in Part I. It looks like this with an explanation of the MRW stuff, here.
|
Did I mention that, when the spreadsheet does the thousand Monte Carlo simulations, it also keeps track of the MRW for each simulation and plots the cumulative distribution?  For example (Figure 11), in 58% of the thousand simulations, the
Maximum Rate of Withdrawal was greater than 10%, >zzzZZZ | 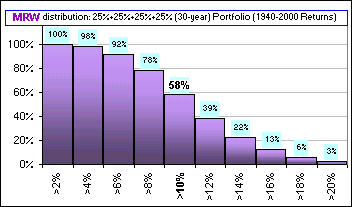 Fig. 11 |
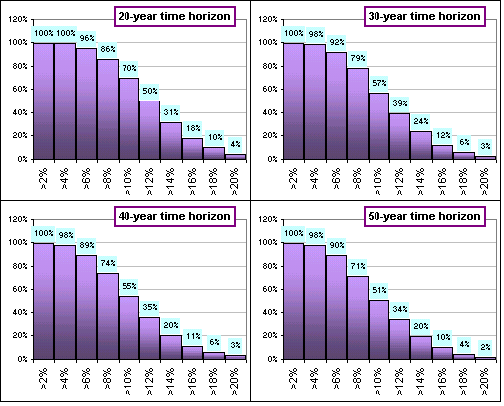 Fig. 12 |
Of course, we're talking
MRW(30) here.
For MRW(40), meaning we're
looking 40 years into the future, these Maxima would be lower
... but not much lower! That's because, as we noted earlier,
MRW would be determined, in large part, by those first
thirty years. (As we noted in Figure 9, for example.) On the left (Figure 12) is the cumulative distribution over 20-, 30-, 40- and 50-year time horizons.
If our Portfolio lasted 20 years with a particular Withdrawal rate,
it'll probably last 40 years >You're kidding, right? |
This is fiction. It assumes the future looks like the past, that Monte Carlo simulations represent all possible futures, it ignores various longer range correlations, it assumes that selecting Random Years from some historical period will ...
>Yeah, yeah. So what do you use?
I've already told you. I use ...
>Don't bother ... I remember. Your
Special Patented Technique.
Uh ... did I mention that the spreadsheet also has some U.S. Bond data? You can replace
one or more of the four asset classes (Large and Small Cap Growth and Value) with, for example,
T-bills or 5-year Treasuries or U.S. Government Long Term Bonds or S&P 500. Even add
your own data - if you can find it (from year 1928 to year 2000). It's just a paste away.
>And ...?
Some Bond component is good for you.
>How good?
Download the spreadsheet and try it for yourself:
Right-click and save the .ZIPd Target File.
There's also a bunch of charts which looks like this
And you might take a peek at
Saving for Retirement.
>Where did all the data come from? In particular, for this
(.ZIP'd) Fama-French data*:
It also includes HML = (1/2)[(S/H + B/H) - (S/L + B/L)]
>Of course, this is fiction, remember? It assumes the future looks
like the past, that Monte Carlo simulations represent all possible futures, it ignores
various longer range correlations, it assumes that selecting Random Years from some historical
period will mimic future market machinations, that what goes 'round comes 'round, that anyone
who professes a 95% Portfolio success rate has the luxury of saying
"Sorry, you were in that last 5%", or even, as
Bernstein says:
"Some deranged colonel in Pyongyang could let loose the four horsemen upon the planet", and then the
future would hardly be a repetition of the past so ...
zzzZZZ
Some from Fama-French,
some from Richard's Page,
maybe from Shiller,
some from the Federal Reserve.
* This F-F data also includes SMB = (1/3)[(S/L + S/M + S/H) - (B/L + B/M + B/H)]
(L, M and H ... which identifies Growth, Neutral and Value stocks,
an identification adopted by Barra).
(the difference between the average
returns on Small and Big portfolios)
(the difference between the average
returns on High and Low portfolios)
>Hello? Anybuddy there?
 Click for Part III about Buying an Annuity.
