| Rotating Portfolio Components: continuation of Re-balancing Part II. |
We consider three (or more ... or fewer!) asset classes or investment sectors - we'll call them sectors, like Financials, Transportation, Pharmaceuticals, Oil & Gas (or some such).
Then, here's what we'll do for each sector:
- We make a table of weekly closing prices and divide each price by the price at the start of our time period, so the modified numbers represent cumulative Gain Factors. This gives a sequence of normalized Prices (or Gain Factors, although we'll just call them "Prices", but understand they're normalized Prices as described above). The sequence then begins with the value 1.00 for each sector.
- At the end of each week we calculate the Moving Average of these end-of-week Prices, going back, say, N weeks like so: MA = (p1 +p2 +p3+... +pN)/N where pN is this week's closing Price and pN-1 is the closing Price for last week, etc..
- We then compare this week's closing Price with the
N-week Moving Average for last week, computing:
gMA = Price(this week) - MA(last week). - We pick one favourite sector, like Financials.
- For next week we invest only in that asset class whose gMA is 10% greater than our favourite gMA.
- At the end of next week, we repeat this ritual, selling all of one sector, if necessary, to buy the other.
>I thought I understood it, but that's confusing.
Okay, let's suppose that we started investing on Jan 7, 1985 and it's now Dec 28, 1992, and
the normalized
prices for each
sector are, for the past 5 weeks (ending on Friday, Dec 28, 1992):
Sector B: 2.569 2.535 2.606 2.586 2.603
Sector C: 1.880 1.919 1.969 1.935 1.930
Notice that sector A ended this week with a price which was 2.065 times greater than its starting price (when our investments began, on Jan 7, 1985). Sector B had a price 2.603 times greater than ...
>I understand that. Please continue.
The 5-week Moving Averages, ending Dec 28, 1992, are then:
MA(B) = (2.569 + 2.535 + 2.606 + 2.586 + 2.603)/5 = 2.580
MA(C) = (1.880 + 1.919 + 1.969 + 1.935 + 1.930)/5 = 1.927
Now, we're going to use these three MAs next week, like so:
We suppose that next week's closing prices (on Friday, Jan 4, 1993) are:
Sector B: 2.673
Sector C: 1.888
Hence, the three gMAs are:
gMA(B) = 2.673 - 2.580 = +0.093
gMA(C) = 1.888 - 2.927 = -0.038
Conclusion?
>Because it's got the biggest gMA, put all our money into
sector B, for the following week.
If it's not already there. Besides, notice that sector B has a
gMA more than
10% greater than that of sector A. We introduce that 10% criterion because asset A is where
we'd like to be and we switch only when there's a significantly better place to be.
>What makes you think that sector B has the greatest potential, for that following week?
If there's no serial correlation in the prices, then it's a
crap shoot. There's no way of knowing what'll be our best bet. However, if the greatest
increase in price, compared to the N-week Moving Average, is
any indication of some trend, then that's where our money goes. The proof, of course, is in
the pudding.
>Let's see the pudding.
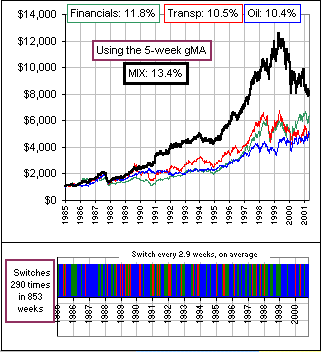
Okay, we'll consider the sectors: Financials, Transportation and Oil, from
Jan 7, 1985 to May 7, 2001,
since that time period includes a crash (in 1987) and a great bull run (in the late nineties)
and bear market in the new millenium. (The data is taken from these Indexes:
Financials,
Transportation,
Oil.)
In fact, the example I gave above, with assets A, B and C, is really taken from this data.
On Jan 4, 1993, we would have switched to asset B = Transportation for a couple of weeks
... because of its gMA.
>But past performance is no indication of future results.
Yeah, that's what they say. But if we really believed that we can learn nothing from the past
then we might as well buy some Index Fund, ignore the market machinations ... and miss all the
fun of investing. Besides, I firmly believe that we can learn from the past, from investor
reaction to plummeting prices, the strife between greed and fear, the behaviour of
markets after a major correction, the onset of irrational exuberance,
the double-digit expectations of the uninitiated - the market is governed as much by human
nature as by gross economic indicators - and ...
>Can I interrupt?
If you must.
>Dec 28, 1992 and Jan 4, 1993 were Mondays.
Now you tell me!
|
>Please continue. Okay. Besides, applying a strategy to historical data is our most rational recourse ... >Please continue. Here's the chart for the three sectors mentioned above: the growth of $1,000 in each of the sectors, their annualized returns, and the result of using 5-week gMAs to obtain a MIX ... where we stick with Financials unless one of the other gMAs is 10% greater. >You used the 5-week gMA? Why? >So you look at the past and decide upon the best value for N? >And you're happy with a switch every three weeks? It looks like
you spent a third of the time with each asset class. All that switching costs ... |  |
 |
>But is a 5 week average the best choice?
 >But you can't know that ... beforehand? Aah, if I knew that beforehand I'd be a multi-millionnaire. |
>Besides, I've heard that Sector Rotation is just an illusion.
Very funny.

