| Regret ... what is it? |
I recently learned something about Regret and ...
>Yeah! Did I tell you the time I didn't ask Sally for a date and ...
Pay attention. I don't mean that regret. I'm talking about the regret if a financial decision falls below your expectations.
It's a notion due (at least in part) to Ron Dembo.
Suppose we have two choices:
- Invest in a risk-free asset with guaranteed return k ... where k = 0.03 means 3%.
- Invest in another asset with a random (hence, perhaps, riskier) return.
If this second portfoolio has a return less than k, we'll regret having made that second choice.
We then ask ourselves: Is there some way to measure our "regret"?
>Huh?
If we pay $1.00 for a lottery ticket which would pays $1 million to the winner - and we lose - we wouldn't cry. It's only $1.00, eh?
However, if we pay $1K for a lottery tocket that pays $1 billion, we would cry if we lost!
This implies that differences in scale matter! See Utility Theory.
Hence there's a difference in "regret" ... whatever "regret" means.
Consider deciding whether to sell your stock or keep it a bit longer.
If we sell and the price goes up, we're unhappy.
If we keep it and the price goes down, we're unhappy.
What to do, to minimize our "regret" ... whatever that means.
When asked how he invested his retirement funds, Markowitz (a father of Modern Portfolio Theory)
answered:
"I should have computed the historic co-variances of the asset classes and drawn an efficient frontier.
Instead ... I split my contributions 50/50 between bonds and equities."
He wanted, he added, to "minimize my future regret."
>So you want to measure ... regret?
Yes. We'd like to compare the two choices on the basis of how we'd feel, having made one or the other.
Let's consider a specific problem:
Should I invest 80% in stocks and 20% in bonds ... or 100% in some risk-free financial instrument that gives a guaranteed return?
|
Suppose that, for the 80/20 portfolio, the returns r have a Mean M and Standard Deviation SD.
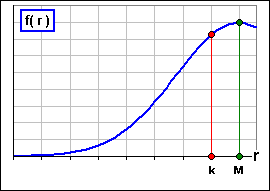
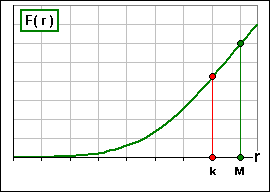
Suppose, too, that the risk-free return is k. Let's also assume that, for the 80/20 portfolio, we can generate a (density) distribution function something like Figure 1A and a cumulative distribution function like Figure 1B. If we choose to invest in the 80/20 portfolio, we'd expect a return of M ... but it isn't guaranteed.
>Beg pardon?
Note that (the mean of r - k) = (the mean of r) - (the mean of k) = M - k.
We also note that the variable r - k has the same standard deviation as r itself, namely SD.
|  Figure 1A
|
[1a] A =  (r - k)2 f(r) dr =
(M - k)2 + SD2 that's (the square of the mean) + (the standard deviation)2
A can also be written:
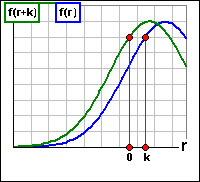
[1b] A =  r2 f(r+k) dr
|
Observations:
|
|
We'd also worry about our whether our portfolio returns will be less than k, so we write down the probability of that happening.
[2] Probability that r < k =  f(r) dr = F(k)
Where, exactly are you heading?
I want to generate (and make sense of) the formula:
| or |
|
We note the following:
- The first piece is just A =
 (r - k)2 f(r) dr = (M - k)2 + SD2
... a measure of how far returns are from k.
- If M = k, then "regret" is just SD2 (Remember: SD = Standard Deviation).
- F(r) is the probability that our return is less than k.
- Regret will decrease if F(r) decreases ... so there's a smaller probability of getting less than k.
- The ...
Uh ... good question.
| a Regret Formula |


