| Noise in Stock Returns |
|
Let's suppose we invest $1.00 in a stock which has a certain gain over, say 60 months.
In fact, let's suppose the monthly gain is constant at 1%. The growth of our portfolio over five years (that's 60 months) would look like Figure 1. >Where do you find such a stock?
We may end up with the same final portfolio, but we've got a lot of randomness, volatility, deviations from that smoooth growth that we got with constant returns. Okay, here's the question: How do we measure that randomness ... or "noise"? >Maybe we can measure how far the jiggly curve deviates from the smooth curve.
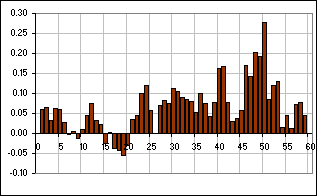 Figure 3 |  Figure 1 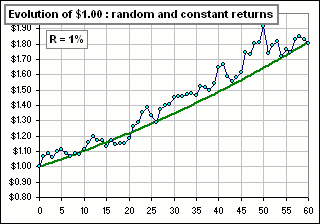 Figure 2 |
>There's no noise in Figure 1, right?
Right. That's the smooth curve, with constant monthly returns.
What I'd like to do is this:
- Assume the random returns are selected from some distribution of returns ... for example, a Normal distribution.
- Assume the distribution has a prescribed Mean and Standard Deviation: R and S.
- Assume the monthly returns are given by: R + N where R is our constant return and N is the Noise.
In fact, we'll assume that N has a mean of 0 and a Standard Deviation of S.
Then it's that noisy component that provides the volatility to our random returns. The Mean of our random returns is just the constant R since the noise, N, has a Mean of 0. - After m months our $1.00 portfolio would be worth (1+R+N1)(1+R+N2)...(1+R+Nm) ... where N1, N2 etc. is our sequence of random numbers.
>If all the Ns were 0 we'd get Figure 1, right?
Right, and with a random assortment of Ns we'd get the jiggly curve in Figure 2.
>And what do the Ns look like?
We'll get to that, but you can see the result of these "Noisy" returns in Figure 3.
>But the average of those numbers is -0.007 and you said the noise has an average of 0.
Our Noise isn't the deviations in the portfolio, (random - smooth), but the deviations in the returns.
However, let's consider for a moment the deviations in the portfolios: (random - smooth).
The random portfolios, after m = 1, 2, 3, ... months would be:
(1+R+N1), (1+R+N1)(1+R+N2), (1+R+N1)(1+R+N2)(1+R+N3), ...
Note that we can factor (1+R) from each term to get:
(1+R){1+N1/(1+R)} and (1+R)2{1+N1/(1+R)}{1+N2/(1+R)} and
(1+R)3{1+N1/(1+R)}{1+N2/(1+R)}{1+N3/(1+R)} etc. etc.
The smooth (constant return) portfolios would be:
(1+R), (1+R)2, (1+R)3, ...
After k months, the difference would be:
[1] Portfolio Deviation(k) = (1+R)k{1+N1/(1+R)}{1+N2/(1+R)}...{1+Nk/(1+R)} - (1+R)k.
Since we expect the Ns to be small compared to 1+R, we'll write:
[2] {1+N1/(1+R)}{1+N2/(1+R)}...{1+Nk/(1+R)} =
1+ (N1+N2+...+Nk)/(1+R) ... approximately.
(That's from multiplying out the factors and retaining only the most significant terms in the product.)
Now (N1+N2+...+Nk) = k*(Mean of the k random values of N)
If we let M(k) be the mean of k random values, then we can replace (N1+N2+...+Nk) by k M(k) and get, from [1] & [2]:
[3] Portfolio Deviation(k) = (1+R)k [1+ k M(k)/(1+R) - 1]
= k M(k) (1+R)k-1 ... approximately
Since we've asumed that the Mean of the Ns is 0, we'd expect that, as k increases, the mean of the k N-values would be near 0.
>So that M(k) would be close to 0, right?
Yes, sometimes positive, sometimes negative.
That'd make the portfolio deviations
(which we now see look something like
k M(k) (1+R)k-1) sometimes positive, sometimes negative as k increases.
Hence we can't expect the Portfolio Deviations to be something nice to look at, as k increases.
(Look again at Figure 3.)
Here's are a few more examples (this time, over 120 months):


>And what can you say about them?
Nothing.
However, let's get back to our Noise which we're defining as the deviation between the Random returns and the Mean return.
However, although that's the customary ritual, I'd like to do something a mite differently.
| Deviations from the Compound Monthly Growth Rate |
After all, if your portfolio went from $1.00 to $1.70 in 60 months, maybe we should take as our "constant" return that which would get us from ...
>$1.00 to $1.70 in 60 months, right?
Yes, and that's not the average or Mean return ... it's the Compound Monthly Growth Rate:
[4] CMGR = ($1.70/$1.00)(1/60) - 1 = 0.0089 or 0.89% per month.
In general, we might prefer to measure Portfolio Deviations as the deviation from the portfolio which would start and end at the same values as our actual portfolio.
|
>Huh? Don't the Mean do that?
No! See Fgure 4? It's a 60-month portfolio which goes from $1.00 to $1.70 in 60 months. See, for example, Average stuff. If we get, each month, the Mean monthly return we'd follow the green curve.
Let's suppose that our $1.00 portfolio ends up, after m months, at the value: p(m).
| 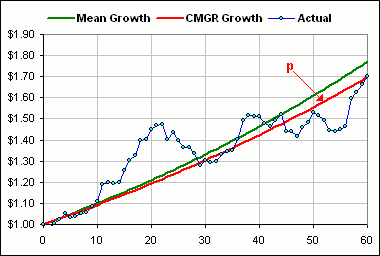 Figure 4 |

[6] CMGR = R = Mean - (1/2)(Standard Deviation)2.
Note that the CMGR return is less than the Mean return for a volatile stock ... since volatility = standard deviation.
>Which explains why the red curve is lower than the green, in Figure 4, eh?
Yes, and that means that our Noise will be measured like so:
|
If the Compound Monthly Growth Rate is R (over m months)
and the actual portfolio returns are r1, r2, ... rm
then we define the monthly Noise at month k as: Nk = rk - R. Note 1:
(1+R)m = (1+r1)(1+r2)...(1+rm)
Note 2:
The final value of a $1.00 portfolio, at month m, can also be written:
|
>Now what?
Well, we can still write (as we did in [1] above):
[1] Portfolio Deviation(k) = (1+R)k{1+N1/(1+R)}{1+N2/(1+R)}...{1+Nk/(1+R)} - (1+R)k.
except our R is no longer the Mean return but the Compound Monthly Return.
>And the Ns are the deviations from that compound return, right?
Right. In fact, we can still use [3], above and get:
[3] Portfolio Deviation(k) = k M(k) (1+R)k-1 ... approximately
If we use [6], above, we can now write:
[7] Portfolio Deviation(k) = k M(k) [1 + M - (1/2)S2]k-1
... approximately
where M and S are the Mean and Standard Deviation of all monthly returns, over m months.
>Now what?
Let's follow those Portfolio Deviations using that constant Mean return and the Compound Monthly return:
>The deviations from a red and green curve, as in Figure 4?
Yes. Here's an example:

>Looks like following the CMGR curve is better, right?
Sometimes. Since the end portfolio value is the same for the CMGR portfolio, the deviation ends up with a $0 value.
