| Miscellaneous Stuff |
|
For N annual returns of r1, r2, ... rN,
(expressed as decimals by dividing the percentage returns by 100), the Annualized Return is: CAGR = [ (1+r1)(1+r2)...(1+rN) ]1/N - 1 |
| Note:
In an MS Excel spreadsheet, if cells A1 to A25 contain 25 returns, then: =AVERAGE(A1:A25) gives the Average (or Arithmetic Mean)) of these Returns. To get the Annualized Return do this: Type: =GEOMEAN(1+A1:A25)-1 but don't hit the Enter key ... yet!! Hold down the Ctrl and Shift keys and NOW hit the Enter key. It changes to {=GEOMEAN(1+A1:A25)-1} giving the Annualized Return. |
Example: for the five annual returns given earlier, we'd get

Note: The Annualized Return is not to be confused with the Average Return $#^@!&#
The Average and Annualized returns would be the same only if all annual returns were the same!
Example: for five returns all equal to R, the average return would equal R. The above prescription would then say:
CAGR = [
(1+R)(1+R)(1+R)(1+R)(1+R)
]1/5 - 1 = 1+R - 1 = R
Note:
What constant annual return would make my portfolio go from $A to $B in n years? |
or (more simply) as 100 [ (B/A)1/n - 1 ] %
See also: Calculating Annualized Returns
Excel Tips:
Above, we noted the slick trick of using =GEOMEAN(1+A1:A25)-1
and Ctrl / Shift / Enter to get the Annualized Return (or geometric mean).
This ritual involves adding 1 to every cell. There are some other similar tricks, like the following (each using Ctrl+Shift+Enter).
In each case there's some arithmetic applied before the calculation:
=PRODUCT(1+A1:A25,1+A1:A25) where "1" is added before the PRODUCT is calculated.
There are (probably!) other neat tricks ... but I don't know 'em
=PRODUCT(1+2*A1:A25,1+2*A1:A25) where each number is multiplied by "2" then added to "1" before the PRODUCT is calculated.
=SUM(A1:A25/100) where each number is divided by 100 before SUMming.
=SUMPRODUCT(A1:A25-A26,A1:A25-A26) where the number in cell A26 is subtracted from every number in A1 to A25 before calculating the SUMPRODUCT.
=SUMPRODUCT(A1:A25-AVERAGE(A1:A25),A1:A25-AVERAGE(A1:A25)) where the AVERAGE is subtracted from each number.
This would give the sum of squares of the deviations from the Mean.
=SUMPRODUCT(A1:A25-A26,A1:A25-A26,N(A1:A25<A26)) where A26 is subtracted from each number and the SUMPRODUCT is calculated for those numbers less than A26.
If A26 is the Mean, then this would give the sum of squares of the deviations from the Mean for those numbers less than the Mean.
=AVERAGE(IF(B1:B25>B14,A1:A25)) where A26 is some date and column B has dates associated with each number in A1 to A25.
The AVERAGE of A1 to A25 is calculated for those numbers with dates less than A26.
=SUM(A1:A25*B1:B25) where each number in A1:A25 is first multiplied by the corresponding number in B1:B25 ... then the SUM of products is calculated.
This is the same as =SUMPRODUCT(A1:A25,B1:B25)


|
Suppose you have a bunch of returns (or any other numbers!) in cells A2 to A20 and bins from B2 to B13 ... as seen here
R<= -50%, -50% < R <= -40%, -40% < R <= -30%, ... and finally R> 60% (You may want to put appropriate labels on a plot as in column C so the chart has these labels on the horizontal axis.) |  |
About Arithmetic and Geometric Means:
What will my portfolio be in two years?
where G1 = 1+P and G1 = 1+Q are the annual Gain Factors.
And A(1+R)2 equals A G1G2
provided (1+R)2 = G1G2 or 1+R = SQRT[G1G2]
and SQRT[G1G2] is the Geometric Mean of the Gain Factors G1 and G2.
That means our annual Gain Factor would be GM, the Geometric Mean of G1 and G2.
A[1+(P+Q)/2]2 where we note that [1+(P+Q)/2] = (1/2)[(1+P) + (1+Q)] = (1/2)[G1+G2].
Hence A[1+(P+Q)/2]2 = A[(1/2)(G1+G2)]2.
That means our annual Gain Factor would be AM, the Arithmetic Mean of G1 and G2.
Using the Average gives $A[1+(P+Q)/2]2 = $A[AM]2
where AM is the Arithmetic Mean of G1 and G2.
Conclusion?
The Geometric Mean of Gain Factors gives the correct, final portfolio value
... not the Arithmetic Mean
... and the Geometric Mean is smaller than the Arithmetic Mean!
See Average vs Annualized.
Note:
There are (at least) two approximations to the Annualized Return if you only know the Mean (or Average) and Standard Deviation (or Volatility):
- AnnualizedReturn = AverageReturn - (1/2) Volatility2
- AnnualizedReturn = SQRT[ (1+AverageReturn)2 - Volatility2 ] - 1
|
The XIRR command. It goes like this:
=XIRR(A1:A50,B1:B50,0.10)
where the range A1:A50 contains the cash flows
It's also important to note when an investment (or withdrawal) is made!
... going from 25% to 50%. The 25% number is (final portfolio)/(initial investment) - 1 = 2500/2000-1 = 0.25 or 25%. The 50% number is (final portfolio)/(initial investment) - 1 = 1500/1000-1 = 0.50 or 50% (where the $1K investment at N = 12 months is ignored). | 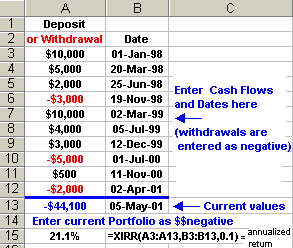
|

Note 1: XIRR is an Excel add-in and may need to be installed.
Note 2: There may be more than one XIRR answer, depending upon your initial guess! (See XIRR.)
Note 3: You can use XIRR to calculate YTD Returns. (See XIRR-stuff.)
About inflation adjustments:
REAL Rate of Return:
Your portfolio is currently worth $A.
Suppose that your $A investment grows at a rate r (r = 0.08 meaning 8%) and inflation is i (i = 0.03 meaning 3%).
R = [(1+r)/(1+i)] - 1.
Note: For small inflation (that is, i is small), one often puts R = r - i which is an approximation to the "REAL" rate of return.
REAL Return ... with several assets:
Now suppose that you have a portfolio with two assets worth $A and $B, so your portfolio is worth A + B.
Aah, but inflation reduces the buying power of your portfolio, so in real terms, it's only worth
[A(1+r1) + B(1+r2)] / (1+i).
[A/(A+B)](1+r1)/ (1+i) + [B/(A+B)](1+r2)/ (1+i).
Moral?
x (1+r1)/ (1+i) + y (1+r2)/ (1+i) - 1 =
[x + y + x r1 + y r2] / (1+i) - 1 =
[1 + x r1 + y r2] / (1+i) - 1 =
(x r1 + y r2 - i) / (1+i).
Note that this is the same as the formula above except that the portfolio return r is replaced by x r1 + y r2.
This ritual extends to a portfolio with a jillion assets ... just use the "weighted" return
Conclusion?
$100 will buy 100/{25(1+.03)8} =
[100/(1+.03)8]/25 items.
At an annual inflation rate of I (I = 0.03 means 3%), the "buying power" of today's $A is
[A/(1+I)N] in N years.
Just divide by (1+Inflation) ... for each year
A particular item is currently worth $P.
Currently, you can buy A/P items.
In N years you may or may not be able to buy that many items; it'll depend upon your portfolio gain and inflation:
Conclusion?
However, the $P items will then cost P(1+i)N.
Hence you can buy [A(1+r)N]/[P(1+i)N] = A/P [(1+r)/(1+i)]N items.
That means that, instead of A/P items, you can buy
A/P [(1+r)/(1+i)]N items (N years from now).
That means that the buying power of your portfolio has increased (or decreased) by a factor [(1+r)/(1+i)]N over N years.
That's equivalent to an increase (or decrease) by a factor [(1+r)/(1+i)] per year.
At an annual portfolio gain of r the "REAL", inflation-adjusted return is
R = [(1+r)/(1+i)] - 1 = (r - i)/(1 + i).
Suppose, further, that the two assets have annual returns of r1 and r2 respectively and that inflation is i.
At the end of the year the assets have changed to A(1+r1) and B(1+r2) so your portfolio is now worth
A(1+r1) + B(1+r2).
The increase (in real terms) is from (A+B) to [A(1+r1) + B(1+r2)] / (1+i) and
(dividing the latter by the former) that's a gain of:
If your portfolio has a fraction x devoted to asset #1 and y = 1 - x devoted to asset #2, then your "real" return is:
Note that the formula can also be written:
x (r1 - i) / (1+i) + y (r2 - i) / (1+i)
so it's the weighted sum of the inflation-adjusted return for each component.

For example, if 60% is devoted asset #1, 30% to asset #2 and 10% to asset #3, then you'd have a real return of:
|
If you think that, because your expenses would be less,
you can live on, say, 75% of your salary (after you retire), and your current salary increases at some annual rate, you can try this (quick-and-dirty) calculator to see how much of your salary you should invest ... until you retire. Warning: the answers may be harmful to your health. |
|
