| the Hurst Exponent : Part III ... a continuation of Part II |
So far we've learned that, if H, the Hurst Exponent for a sequence of daily stock returns is (about) 0.5, then we conclude that the returns are independent and uncorrelated and there is no trending in the stock price.
>Do you believe that?
That's irrelevant. I'm talking about what the experts believe ... and what Hurst himself believed.
On the other hand, if H is significantly greater than 0.5 then we conclude that positive returns tend to follow positive returns and ...
>Negative returns tend to follow negative returns.
Yes, that's the so-called Joseph Effect, as in the Old Testament where the prophet foretold of seven years of prosperity followed by seven years of famine.
The implication, when H is significantly greater than 0.5, is that the sequence of returns has "memory" ... unlike the tossing of a coin
where the probability of a head is still 50% even after having tossed 100 heads.
Indeed, if H is significantly less than 0.5, then ...
>Wait! If Hurst started all this with floods on the Nile, then presumabley it's good for things other than financial stuff, right?
Yes. Mandelbrot (the Father of Fractals) has used it to identify 11-year sunspot cycles.
>How'd he do that?
Let me continue. If H is significantly less than 0.5, then some say that it suggests
Reversion to The Mean.
(See also RTM.)
That is, if a return is far from the Mean, the subsequent returns tend to move toward the Mean rather than continuing to be far from the Mean
(as in Joseph's Effect).
>Do you believe that?
Pay attention!
| I've read articles suggesting that the period, or number of data points, is important.
Figure 1A shows 50 data points, using the daily returns from Dec 30, 2003 to Dec 28, 2004, with a 5 day increment. >Nice fit, eh?
>Figure 1B?
| 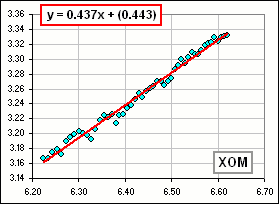 Figure 1A log(R/s) vs log(n) with just 50 points 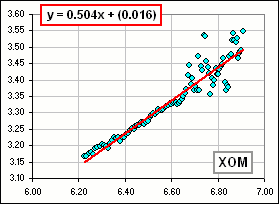 Figure 1B Using 100 points |
Uh ... yes.

|
Look at the variation in the Y(k), in Figure 2.
After the smooth section, the Maximum and Minimum (hence the difference, R) doesn't change. (See the coloured dots?) Since we're measuring R/s (the rescaled range statistic), where s is the Standard Deviation (or volatility), you can see that the stock becomes very volatile. Hence the plot of log(R/s) in Figure 1B becomes kind of ... uh ... >Ragged?
| 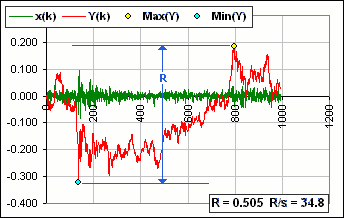 Figure 2 |
Well, I download 1000 daily returns for XOM, then I use the first 500 daily returns (so k goes from 1 to 500).
Then, with increment = 5 days, I use the first 505 (so k goes from 1 to 505), then 510 etc. etc.,
Eventually I get all 1000 daily returns involved, with 500 ranges for k ... namely: (1,500) then (1,510) then (1,520) then ... then (1,1000).
>Is that legal?
I have no idea.
>Do you really understand this stuff?
I have no idea, but I don't think that many "definitions" (that I often see) are particularly useful 
| the Hurst Exponent, H
A measure of the bias in fractional Brownian motion. For Brownian motion, H = 0.50. For a persistent or trend-reinforcing series, 0.50 < H < 1.00. For mean-reverting or an anti-persistent system, 0 < H < 0.50. The inverse of the Hurst exponent is equal to alpha, the characteristic exponent for Stable Paretian distributions. The fractal dimension of a time series, D, is equivalent to 2-H. |
On the other hand, there are those who say:
| [1] R/s = k nH
so log(R/s) vs log(n) has slope equal to H as in Figure 1. |
In the opinion of some (in which case we should write R/s ∼ k nH) ... which explains why I've used n values like 500 to 1000.
On the other hand, if you want to identify "current" trends (or lack thereof), you wouldn't want to use four years worth of data. That's hardly "current".
On the other hand, to see if [1] really holds, some sample jillions of values of R/s via Monte Carlo (generating the returns by random selections from some assumed distribution) to see what happens if n is small or large ... or whatever.
On the other hand, some say you should pick several time periods (with a fixed n, and k = 1 to n), calculate R/s for each and average these calculated values to get the "Expected" value for R/s. Then, of course, one can argue whether these time periods can or should be overlapping ... or not.
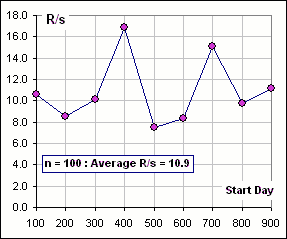
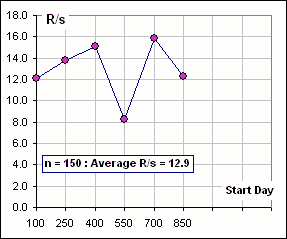
For example, we might look at about a thousand daily returns for XOM stock, from Jan, 2002 to Jan, 2006, and subdivide this 4-year interval into n = 100 day intervals and do a R/s calculation of each 100-day equence of returns. Then we repeat for n = 150, n = 200, etc.. We'd get R/s values like this:

|
Now, if we plot log(R/s) vs log(n) we get a slope of 0.38 which we might accept as ...
>As the Hurst Exponent?
>That 0.38 value, how does it compare to what the spreadsheet gives?
>So what's the correct answer?
| 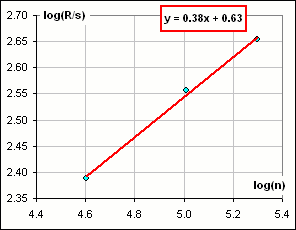 Figure 3 |
One author notes that several "Hurst Calculators" give different answers for the same data. 
>Not surprising, eh?
Yeah. I suspect that, if you ask three financial gurus to calculate the Hurst Exponent, you'd get four different answers.
Indeed. It's amusing to read what I think is the best source of info, by
Ian Kaplan
(at bearcave.com), where he says:
I had no problem finding references on the rescaled range statistic. A Google search for "rescaled range" hurst returned over 700 references. What I had difficulty finding were references that were correct and that I could understand well enough to implement the rescaled range algorithm.Note: If you do this google search now (Jan, 2006), there are almost 10,000 references !!
In fact, in writing this tutorial I did a google on simply hurst exponent and got over 33,000 hits.
>And you read them all, eh?
Of course!


