| Fractals |
We want to (hopefully) understand, then explain, fractals.
>Why?
They're fascinating and, if we're lucky, we can see their use in financial theory.
| Julia and Mandelbrot |
We'll start with Gaston Maurice Julia, born in 1893. In 1928 he published a paper descibing the iterations of a function and ...
>Huh?
Consider this:
- We start with some point in the plane, say (x,y) and a couple of fixed parameters "a" and "b".
- We then generate another point (x1, y1) via the formulas:
[a1] x1 = x2 - y2 + a
[b1] y1 = 2xy + b - Then we continue with formulas [a1] and [b1], but using x1 and y1 to generate another point (x2, y2):
[a2] x2 = x12 - y12 + a
[b2] y2 = 2x1y1 + b - Then we continue with formulas [a2] and [b2], but using x2 and y2 to generate (x3, y3):
[a3] x3 = x22 - y22 + a
[b3] y3 = 2x2y2 + b - Then we continue with formulas [a3] and [b3], but using x3 and y3 ...
|
>Okay! I get it, but what's so good about that?
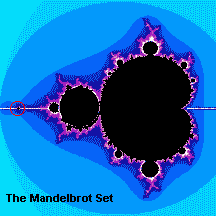
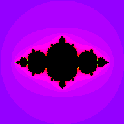
The boundary between the points (x,y) that produce either [A] or [B] might look like Figure 1: a Julia Set It's even more interesting to identify the points which remain finite (and paint them black) as well as those which head off to infinity and even to colour the latter points according to how quickly they head off to infinity. If you do that, you'd get something like Figure 2. >What's "a" and "b"?
| 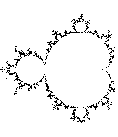 Figure 1
|

Note that, starting with (x,y) = (0.5, 0.5), the iterations head off to infinity ... and we'd colour the point (0.5, 0.5) according to how rapidly it moved off.
That is, how many iterations it took to leave some predefined neighbourhood of the origin. (For example, how rapidly if moved out of a circle of radius 2 units, centred on the origin.)
>I assume there are other neat pictures if you change a and b?
Yes. Take a look at some pretty pictures
here
I should also point out that our prescription for iterating, namely 1, 2, 3, 4 etc. above, can
be simplified by writing the iteration formula as:
zn+1 = zn+12 + c
where z = x+iy and c = a+ib and i = SQRT(-1) is the imaginary unit.
>Huh?
Don't worry about it.
>Mandelbrot?
Yes. Benoit Mandelbrot,
born in 1924 in Poland, is the Father of Fractals.
| Koch snowflake |
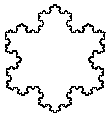
| 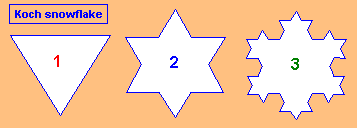 Figure 3A
|
Yes. After three more of these rituals we get 3072 sides and it looks like Figure 3B.
>You want me to count the number of sides?
At step n, the number of sides is 3(4n) so the number of sides are 3, then 3(4), then 3(42), etc.
However, notice that at each step we replace a single line segment by four line segments, each 1/3 the size.
The original line segments had length 1, then (1/3), then (1/3)2, etc.
>So the TOTAL length is ... uh ...
It's (number of segments)x(length of each segment) = 3(4n) x (1/3)n = 3(4/3)n, after n steps.
It's called the Koch snowflake
(you can play with it here),
named after
Helge von Koch, born 1870 in Sweden.
After an infinite number of such rituals there are infinitely many "sides" and the length of the
"snowflake" boundary is infinite yet the entire snowflake will fit in your pocket and it encloses a finite area and ...
|
>So?
Look again at the Mandelbrot Set >Very funny. You just displayed the same picture!
In fact, some of those wee bulbs sticking out, in the Mandelbrot Set, look like this >Wow! But when do we get to financial stuff?
| 
|
| Sierpinksi Carpet |
|
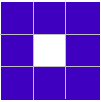
Here we start with a square, then we remove the middle ninth, leaving eight squares.
Then for each of the remaining eight squares we remove ... >Remove the middle ninth, etc. etc., right?
>But I don't see eight remaining squares, do you?
| 
Figure 3c |
It's a fractal, named after Waclaw Sierpinski (1882-1969).
>How do you know it's a fractal?
Well, its Hausdorff-Besicovitch dimension exceeds its topological dimension.
>Aw ... c'mon.
| Dimension |
>Like 47 metres or 59 acres or ...?
Not exactly. Consider this:
>We're talking length, area and volume, right?
>But it's a curve so it has dimension 1.
| 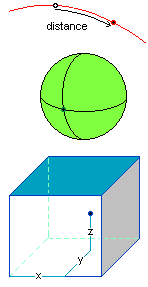
Figure 4 |
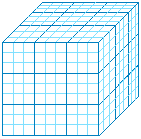
Figure 5 |
|
>But we already knew that! A cube is 3-dimensional!
Sure, but it's a somewhat different determination of dimension, eh?
>You call it "measure". Why not just plain "volume"?
We'll use this procedure to calculate the dimension of objects that aren't as simple as a cube.
The general rule for self-similar objects is:
| fractal dimension = log(number of self-similar pieces) / log(reduction factor) |
|
>For a square it'd be ... uh ...
| 
|
>Okay, each step reduces the side length by 1/3 so (reduction factor) = 3.
Yes, and each side would become 4 sides, so the (number of self-similar pieces) = 4.
>So the dimension of the snowflake is log(4)/log(3) ... uh, logarithms to what base?
It doesn't matter.
To base 10 it'd be 0.60206/0.47712 = 1.26.
To base e it'd be 1.38629/1.09861 = 1.26.
>And since it's a curve, then ... hey! A dimension of 1.26? Is that possible?
It's not your ordinary, garden variety dimension, eh? It's called the (are you ready for this?) the
Hausdorff-Besicovitch
dimension.
It started as an ordinary, garden variety curve but became an infinitely detailed object.
This infinite detail actually increased its dimension a schnitzel ... from 1 to 1.26.
>This is weird.
Isn't it, especially when we're so familiar with dimensions of "1" or "2" or ...
>They're the "ordinary" dimensions, eh?
Actually, the basic, garden-variety dimension is called the "topological" dimension
whereas the "fractal" or "Hausdorff" dimension may (or may not) be equal the topological dimension.
In fact, in the words of Mandelbrot:
A fractal is by definition a set for which the Hausdorff-Besicovitch dimension strictly exceeds the topological dimension.
|
Let's do the following:
|

|
>Okay, I get it. So?
So, at each step, we increase the number of pieces: 1 then 2 then 4 then 8 then ...
>That's 2n?
Yes, but the pieces get smaller. They're 1/3 of the earlier length.
At each step we multiply the number pieces by 2.
At each step the reduction factor is 3.
The Hausdorff dimension ...
>Let me do it!
(reduction factor) = 3
(number of self-similar pieces) = 2.
fractal dimension = log(2)/log(3)
Very good ... and log(2)/log(3) = 0.631 which is greater than the topological dimension which is 0 so ...
>Huh?
How much of the original line has been cut out?
We'll add all the segment lengths that have been removed.
That's the sum of terms like: (number of segments removed)(length of each removed segment)
and that's: 1/3 + 2(1/32) + 22(1/32) + 23(1/33) + ...
or (1/3)[1 + 2/3 + (2/3)2 + (2/3)3 + ...]
and that infinite series adds up to (1/3)/(1 - 2/3) = 1.
>That's the entire original line!
Yes, so what's left is ... uh, nothing.
>I'd say the topological dimension is zero.
Yes, and since the Hausdorff dimension, namely 0.631,
is greater than 0, the Cantor Set is a fractal.
>The what?
Named after Georg Cantor (1845-1918).
Okay, now compute the Hausdorff dimension of the Sierpinski carpet.
>Gimme a hint.
It's 1.893.
| the Peano curve |

Now we'll consider another curve ("one of the most remarkable ...", says Hausdorff), invented by Giuseppe Peano, born in 1858 in Italy.
We start with a single line segment, then replace it with 
Although it looks like a line replaced by something involving a rectangle, it's actually replacing
one line segment by nine line segments 
>I'll calculate its dimension, okay?
We replace one line by nine, so (number of self-similar pieces) = 9.
It looks like each of these nine is 1/3 of the original line segment, so (reduction factor) = 3.
The dimension of peano's curve is then log(9)/log(3) = log(32)/log(3) = 2.
Does that surprise you?
>Nothing surprises me any more.
But that's the dimension of a plane or a square ... a 2-dimensional object.
>So?
So, in 1890, Peano published this curve. It's a space filling curve. After an infinite number of "replacements"
Peano's curve actually completely fills a square! (You can see a picture
here.)
>Which explains why its dimension is 2, eh?
You got it!
Indeed, before Peano, it wasn't thought possible to define a "curve" that entirely filled a
square!
Now everybuddy has their own version of space-filling curves 
(See, for example,
Hilbert's version.)
| Natural Objects |
>And financial stuff? What about financial stuff?
Patience. Aren't we having fun?
>Well ... yes, as a matter of fact. I'm enjoying this!
Me too! Have you seen
these, especially
the one that looks like a fern?
>That's nice, but what about financial stuff?
Take a look at the
Mandelbrot
article which appeared in the scientific American.

 for Part II