| Drawdown stuff |
Suppose you'd like to know the largest loss you might have suffered, had you invested in stock ABC.
You might, for example, follow the maximum stock price as the weeks go by and ...
| >And see how much the price has dropped from that maximum?
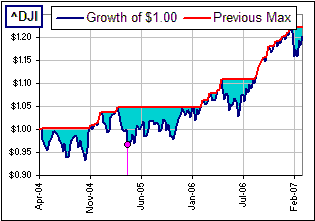
Sure. Why not? See Figure 1? It shows the weekly values of a $1.00 DOW portfolio, and we're following the maximum prices. The shaded areas display the drops from that running maximum. >The drop is in $dollars? Why not a percentage of the most recent maximum?
|  Figure 1 |
>You're just looking at weekly prices, right?
Yes, but ...
>Don't tell me! You got a spreadsheet.
Uh ... yes. It looks like this:

You type in some dates and whether you'd like daily, weekly or monthly data and enter four stocks and click a button and gaze in awe at the pretty pictures.
>And I just click on the picture of the spreadsheet in order to ...
In order to download the spreadsheet.
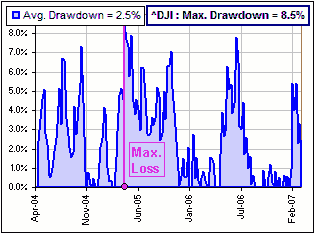
You might take this largest drop from the last maximum as a measure of "risk", eh?
At least it measures a loss rather than deviations from a mean return (as does that "other" risk measure: standard deviation). 
>What's this drawdown stuff?
Uh ... I understand that, among the various definitions of "drawdown", this drop from the previous maximum is called a drawdown.
>Are you sure?
Huh? Me? Sure? How can anybuddy be sure of anything these days ...
PS#1
I might note that, having downloaded four sets of prices, you can then download a single stock or index to compare.
In the picture above, we've picked the S&P500 with symbol: ^GSPC
PS#2
If'n the spreadsheet don't work good, there's a money-back guarantee ...
PS#3
The spreadsheet may change dramatically without notice. (It may be a change from the pretty picture, above).
PS#4
There's another similar spreadsheet described here.
