| Down then Up then Buy then Pray |
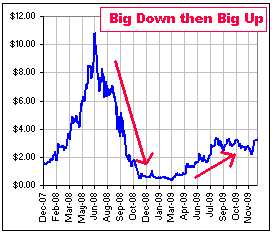
| At this time of year I'm looking for a nice stock to buy. Some guy who's down from his high over the past couple of years and ...
>And who continues down to $0! >Big Up? Doesn't look that big to me.
>That's a real stock?
|  |
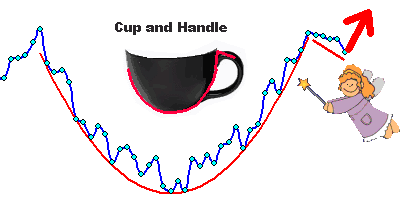
| >Isn't that a standard pattern ... like teacups or something?
Cup and Handle? That one looks like this 
Previous highs are regained, then a drop then ... >Then the stock takes off, right?
>But Down Big then Up Big? Do you believe ...
|  |
>You expect the stock to revisit its high ... in the near future?
Uh ... certainly. Doesn't that always happen? 

>So what do your call this Down then Up pattern?
I'm thinking ... 
>Big Down Big Up is BDBU, so how 'about BaDaBoom? See? It's got that Boom at the end.
You're kidding.

