| Correlations |
We've talked about correlations in the past and remarked on some definitions found on the Internet:
The correlation coefficient is calculated as:and, in particular, some common misconceptions, like:

The correlation coefficient of two stocks characterizes the price interdependence between them. This value ranges from -1 to 1. A coefficient near 1 (Correlated) signifies similarity in price behavior, whereas a value near -1 (Anti-correlated) signifies inverse price behaviorand
(i.e. when one stock goes up the other goes down and vice versa).
Correlation is computed into what is known as the correlation coefficient, which ranges between -1 and +1. Perfect positive correlation (a correlation co-efficient of +1) implies that as one security moves, either up or down, the other security will move in lockstep, in the same direction. Alternatively, perfect negative correlation means that if one security moves in either direction the security that is perfectly negatively correlated will move by an equal amount in the opposite direction.
>So?
Here are the returns for two stocks:

As you can see, they both have positive returns, hence move up together ... yet the correlation is (surprise!) -1. 
In fact, it is NOT the stock prices that tend to move together (for a correlation near +1).
Or, to put it differently, it is NOT the returns that tend to be positive (or negative) together.
In fact, a positive correlation (near +1) means that the returns tend to move together above and below their Mean
In the example above, when a return in the first set is above the Mean, the corresponding member of the second set is below the Mean ... and vice versa.
>And that makes the correlation is -1, right?
Right.
>But what would I calculate if I want to recognize when stock prices go up and down together?
Then you wouldn't include the Mean in your calculations. 
In fact, you just calculate a Stock Comparison, like so:
|
>That don't look like the standard garden-variety correlation.
It's the same as the standard garden-variety correlation (or Pearson product-moment Correlation Coefficient)
except that we set the Mean = 0 in the magic formula and ...
>But is it a number between -1 and +1? I mean, that'd be required, eh?
Uh ... yes. You can check that out here.
>What about that example, above, where the correlation is -1? What's the gSC for them two sets of returns? I'd say close to +1 because ...?
Close, but no cigar. It's gSC = 0.77 
>And if I want to compare real stock returns?
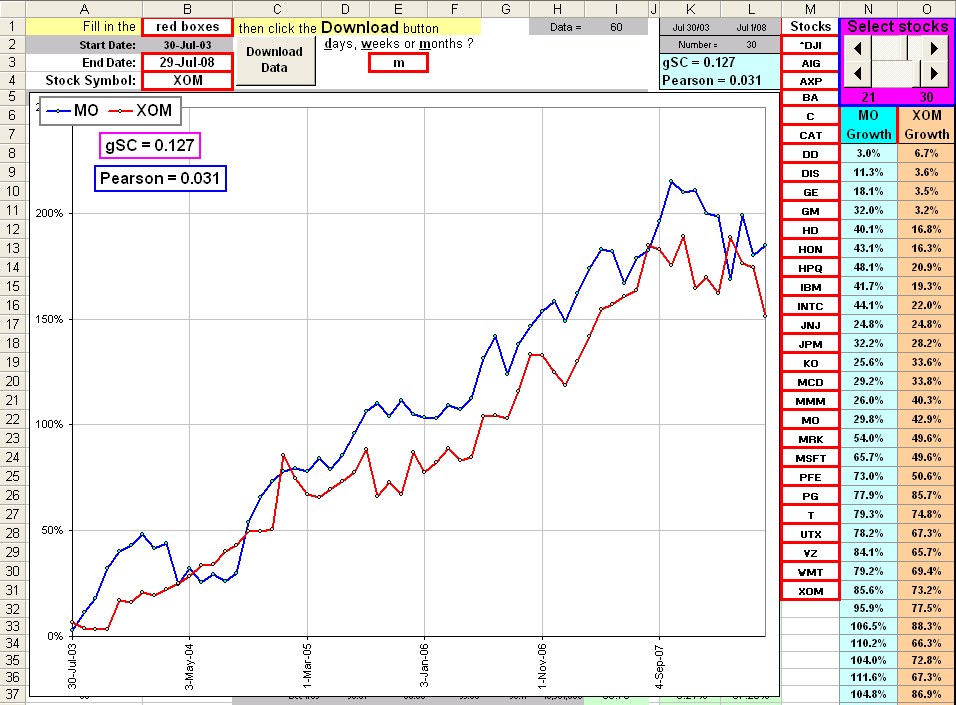
You can use this spreadsheet. Just click on the picture to download.
- Type in up to 30 Yahoo stock symbols in column M.
- Click the Download button.
- After downloading, you can pick any two using the sliders near cells N3 and N4.
In the example, they're stocks #21 and #30, namely MO and XOM. - You get the Pearson correlation and the gSC as well as a chart showing the growth of each selected stock.
>That's it?
There ain't nothin' else to say ... is there? 
I should warn you that there usually ain't that much difference between the Pearson correlation and the gSC.
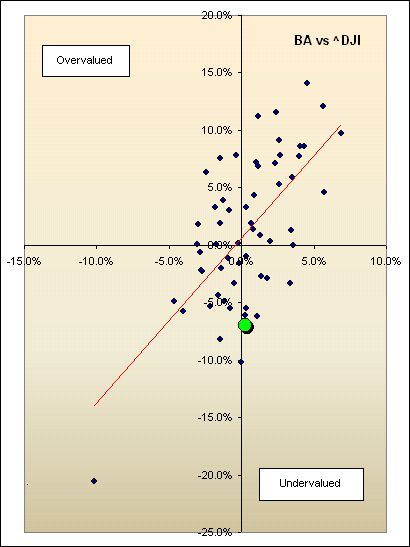
Ron McEwan has modified the spreadsheet to add a neat scatter plot of returns, like so 
If you choose monthly returns you get a plot of all the monthly returns over the past five years.
>Is that good?
>Out-of-whack? Is that a technical term?
>So you buy BA?
>I'll buy BA ...
|  |
| gC2 |
I'll call it gC2 (for Comparison #2).
It just counts the number of times the returns have the same sign, so it's a percentage (between 0% and 100%).
The spreadsheet is the one noted above ... with additions: Click!

