| Correlation and Time Periods |
So I read, in a discussion forum, a comment that
"Correlations will change depending on if you use yearly, monthly, or daily data "
and I think ...
>You think he's all wet, eh?
Well, I think it's unlikely that they're the same, but they're probably very close, so I ...
>You decide to test it, eh?
You just type in the Yahoo symbols for a couple of stocks in cells K6 and L6 ... and click the Download button.
>What's that other do Correlations button?
Here are some others:
>So when people talk about correlation, what one do they mean?
>Yeah, so?
The following returns have a correlation of -1.0 (or -100%).
>What about correlation between prices?
>So when people talk about correlation, what do they mean?
Stop interrupting!
Yes, I decide to demonstrate that the correlation calculated on the basis of daily or monthly or annual returns ... they won't be so different.
When the smoke has cleared, I get this:

>Mamma mia!
You took the words right outta my mouth!
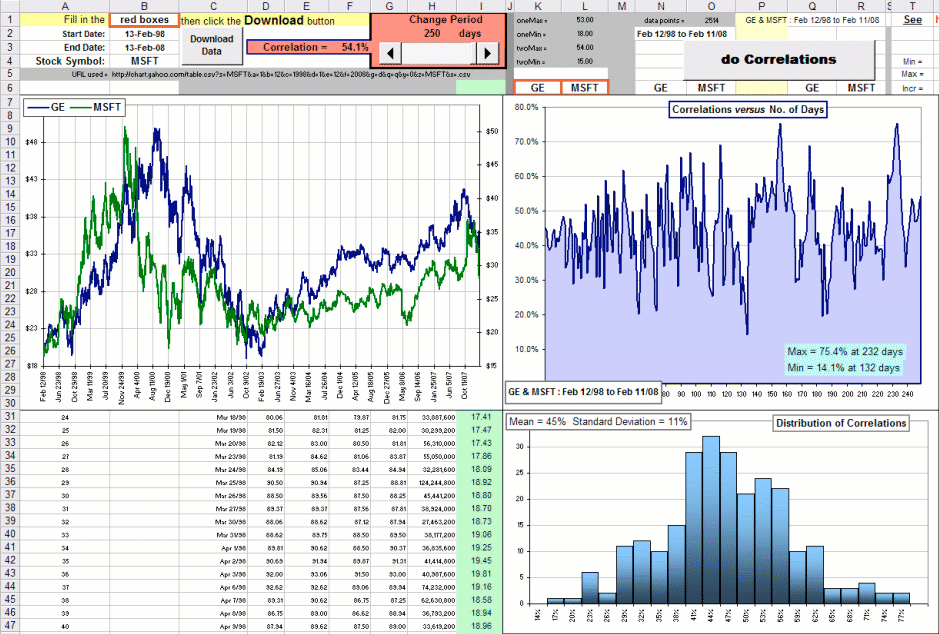
You can also move that slider to pick a time period from N = 1 to N = 250 to see the Correlation for that number of days.
You can ...
I was getting to that!
If you click it, you can see the right charts materialize before your eyes. It's very pretty.
>That's your opinion ...
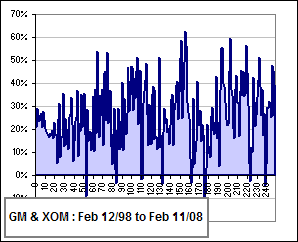
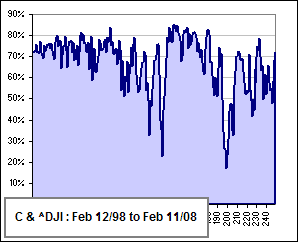

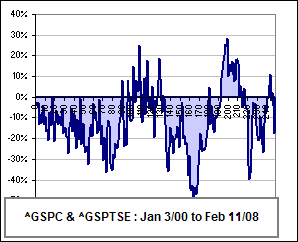
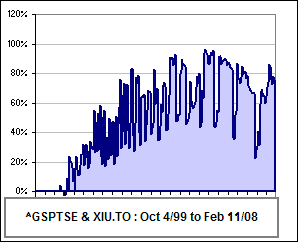

Beats me ... but I think it's common practice to use monthly returns over the past three years.
However, I note that most discussions of correlation between assets make statements like so ... without indicating what returns are to be used:
"The correlation coefficient of two stocks characterizes the price interdependence between them."
"We've also seen that if a pair of stocks have a correlation of -1 then their risk cancels out, so this may be a particularly interesting pair of stocks to own."
"Correlation analysis attempts to measure the strength of relationships by means of a single number varying between -1 to 1 called the correlation coefficient."
"... these products have a very high correlation with the stock market and therefore make lousy diversifiers."
Correlation means ... what?
Besides having a value that depends upon the time period (as indicated above), there's another interesting feature of "correlation":
When we speak of Correlation between two assets, we usually expect that high positive correlation (near 1.0 or 100%) means their returns tend to be positive (or negative) together.
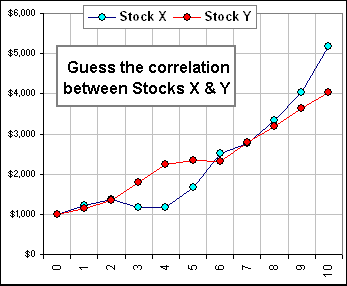
So, don't be so sure. Take a gander at this chart 
You may think that there's a fairly high correlation. In fact, the correlation is -1.0 (or -100%).

The Y-returns are obtained from the X-returns via: Y = 20% - X/10
It's 98% (or 0.98, if you prefer).
I've already answered that question.
