| Call Options: Part II ... a continuation of Part I |
|
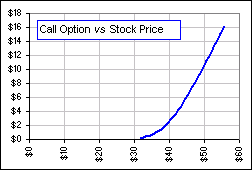
Stare intently at the chart here If the strike price of the call option ($K) is greater than the current stock price ($P), then exercising a call option will get you stock more expensive than buying it on the market 
Nevertheless, the call is still worth something. Who knows, if there's lots of time left until the option expires, the stock price could increase and exceed the
strike price and ...
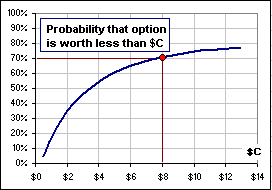
|  Figure 1 |
>Yeah, yeah ... so sell it!
That's what we want to talk about ...
We consider the following:
- A stock has a Mean Annual Return is R
- The Volatility (or Standard Deviation) is V
- The Stock Price is P
- We assume a Risk-free Rate of rf
- A particular Call Option has a Strike Price of K and a time to expiry of T.
- For the cost of the option, $C, we'll use the Black-Scholes Option Premium given by:
C = P N[d1] - K e-rfT N[d2]
where
d1 = { log(P/K) + (rf+V2/2)T } / { V SQRT(T) }
d2 = d1 - V SQRT(T)
N is the standard normal cumulative distribution (with Mean = 0, Standard Deviation = 1)
(See Black-Scholes)
Here's what we'll do:
- We buy a Call Option which expires in T0 years.
- We pay $C for the option, as given by the B-S formula, above, with time to expiry T = T0.
- After T1 years, we sell the option.
- After T1 years the time remaining (to expiry) is then T = T0 - T1.
- If we knew the stock price at time T1 we could get the price of the option ... to determine if it's worth more than we paid for it !
- We can, however, generate a probabilty distribution for the stock price after T1 years.
Stare at the B-S formula.
If we KNEW the stock price at time T1 (that's P, in the formula), then we know the price of the option, right?
|
>But, at some time in the future, do we KNOW the stock price?
Let me check. Just kidding! We don't know the price, but we can generate a distribution of prices, something like Figure 1A. >Then what?
>Then what?
>"Best", meaning the biggest probability that the option is worth more than we paid?
|  Figure 1A
|

Then we pick another option, with different parameters, looking for the parameters that's the "best". In particular, a suggested strategy is to buy a call which expires in T0 = 6 months and sell it after T1 = 3 months. That's the 6/3 strategy discussed on the Motley Fool.
>Mamma mia! Find the "best"? Normal distributions and stuff!! That's a lot of work! I assume there's a ...
A spreadsheet? It's coming but ...
>How about a real, live example?
Okay. Let's assume that we're considering buying a call where the parameters are:
- Mean Annual Return of the stock is R = 0.08 (that's 8%).
- The stock Volatility (or Standard Deviation) is V = 0.30 (that's 30%).
- The Stock Price is P = $38.
- We'll assume a Risk-free Rate of rf = 0.04 (that's 4%).
- We consider a Call Option with a Strike Price of K = $40 and a time to expiry of T = 0.50 (that's six months).
- The Black-Scholes cost of the option is:
C = P N[d1] - K e-rfT N[d2]
where
d1 = { log(P/K) + (rf+V2/2)T } / { V SQRT(T) }
d2 = d1 - V SQRT(T)
so
d1 = { log(38/40) + (0.04+(0.30)2/2)(0.50) } / { (0.30) SQRT(0.50) } = -0.04145 and N[-0.04145] = 0.48347
d2 = d1 - (0.30) SQRT(0.50) = -0.25358 and N[-0.25358] = 0.39999
so C = 38 N[d1] - 40 e-(0.04)(0.50) N[d2] = 38 (0.48347) - 40 e-(0.02) (0.39999) = $2.69
We consider selling after three months. That leaves another 3 months until expiry. The value of our option depends upon the stock price at this time. Things look like this:
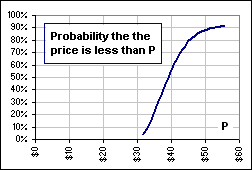

The middle chart shows the distribution of stock prices after 3 months (using a formula described here, somewhere).
The right chart shows the probability that our option is worth less than what we paid. (We paid $2.69)
>There's a 57% of losing money, so a 47% of making money, right?
It's 43%. You're arithmetically challenged! Note, however, that we're ignoring the cost of trading in options
>Is that the "best"?
I have no idea ... yet.


)