|
Breaking Even in the market ... maybe
|
Here's the scenario:
- We have no shares of stock, but $10,030 in our pocket.
- We buy 1000 shares of stock at $10.00 per share + $30 transaction costs. Total cost = $10,030.
- Now we have 1000 shares of stock and nothing in our pocket.
- Later, we sell these 1000 shares for $15.00 and pay the $30 transaction costs.
- The net income from this sale is then $15,000 - $30 = $14,970
- So far we have no stock, but $14,970 in our pocket.
- Later, we buy 1000 shares (again!) for $13.00/share.
- The cost is $13,000 + $30 = $13,030, but we have $14,970 in our pocket
(from the earlier sale), so we
spend the $13,030 and keep the balance of $14,970 - $13,030 = $1940 in our pocket.
- How we doin' so far?
We have 1000 shares of stock and $1940 in our pocket.
BIG QUESTION: What must we get for our stock in order to Break Even?
We originally had no shares, but $10,030 in our pocket.
We now have 1000 shares and $1940 in our pocket.
If we sell the stock
for $S per share, we'd get 1000S - $30
($30 Transaction_Cost, remember?) added to what's in our pocket (namely $1940), so, we'd have
1000S - $30 + $1940 in our pocket. In order to recover the original $10,030, we'd need:
1000S - 30 + 1940 = 10,030
which means our Break Even stock price is now:
S = (10,030-1940+30)/1000 = $8.12
The stock must now drop to less than $8.12 before we lose money on this stock.
Is this a good strategy?
>Strategy? What strategy?
Well ...uh, I mean, can we sell when the stock goes up somewhat, then buy back at a lower price
(we hope) then sell when it goes up a bit, then buy back ... etc. etc. with the object being to
| Lower our Break Even stock price? |
Let's manipulate the formula:
S = { 10,030-1940+30}/1000 = $8.12
The $10,030 comes from 1000*$10.00 + $30
That's: 1000 Shares x Price_per_share + Transaction_Cost
The $1940 comes from ($14,970)
- ($13,030) which is:
(1000*$15.00
- $30)
-
(1000*$13.00 + $30
)
More of the same: 1000 Shares x Price_per_share +/- Transaction_Cost
Altogether now:
S = {
1000*$10.00 + $30
-
(1000*$15.00
- $30 )
+
(1000*$13.00 + $30
)
+ $30
}
/1000 = $8.12
or, to put it in more palatable form:
S = ( 1000*($10.00 - $15.00 + $13.00)
+ 4*$30 )/1000 = $8.12
You'll recognize the various stock prices
... and the four trades resulted in four Transaction_Costs.
As y'all kin imagine, if'n we do this fer N trades ... ending with a BUY, so we have 1000 shares
and ask
"What's my Break Even?" ... and the stock prices are:
$P1, $P2, $P3 ... we'd git:
Break_Even_Price = (
1000($P1 - $P2 + $P3 - + ... + $PN) + $30(N+1)
)/1000
or, better yet:
|
Break_Even_Price =
$P1 - $P2 + $P3 - + ... + $P
N +
$30 (N+1)/1000
|
where, of course, you can change the $30 to
some appropriate value as well 1000, the number of shares involved.
>And for a Buy-and-Hold strategy? What's the Break Even?
Good question. There are just two trades: Buy at P1 and sell at
the Break_Even.
The formula gives P1 + 30(2)/1000. To see the difference (and we'll
ignore the transaction costs for the time being), we can rewrite our magic formula like so:
|
Break_Even_Price =
P1 - (P2 - P3)
-(P4 - P5)
-(P6 - P7)
- ...
|
If we're always selling at one price then buying back at a lower price then subtracting
all of them thar
terms like (P4 - P5) will lower the Break_Even_Price.
>But do we make any money?
Suppose we sell our 1000 shares at the price $P (after playing this game just
three times). What we get is:
1000P - $30
and what we paid (our total out-of-pocket expense) is:
(1000P1 + $30)
- (1000P2 - $30)
+ (1000P3 + $30)
where it costs an extra $30 to buy and we make $30 less when we sell
Our total profit is the difference between these two
guys, so, subtracting the second from the first, we get:
Profit = 1000(P - P1
+ P2 - P3) - 30(4)
see the four transaction charges ... reducing our profit?
If'n we divide by 1000 we get the:
Profit_per_Share = P - { P1
- P2 + P3 + 30(4)/1000 }
Or, better yet, if we sell at $P:
|
Profit_per_Share = P - Break_Even_Price
|
Uh ... one other thing. The second guy, above
... that's our out-of-pocket investment ... is just
1000(Break_Even_Price) - $30 so we have (if we sell at $P):
|
Investment_per_Share = Break_Even_Price - $30/1000
|
Okay, we have a formula so let's play. We'll continue with the hypothetical trades we started:
Buy 1000 @ $10, Sell 1000 @ $15, Buy 1000 @ $13, etc. etc.
 The break even (after 10 trades, including the final sale of our 1000 shares) is:
10 - 15 + 13 - 17 + 15 - 18 + 16 - 18 + 13 + 10(30)/1000 = - 0.70
>Isn't that negative seventy cents?
Yup! I got me 1000 shares of stock tradin' 'bout $13 and it can drop
to zero and I won't lose money. I've made back all of my initial investment with the
various gains, so I can afford to give away my 1000 shares and still smile.

|
>What're the chances of making money, timing the market?
Hmmm ... good question ...
Here's an example where, in Dec/79, we buy 1000 shares of the DOW for $829
(assuming we can buy a stock that mimics the DOW Industrials).
Then, when the stock has increased by 5%, we sell.
When it has dropped by 2%, we buy again. (Transaction costs are $30 per trade.)
After a few trades we've sold at $923 (in Sep/82)
and the stock never again drops by 2%, below that price ... so we never
buy any more. We're out of the market for almost twenty years!!
We gotta do something about this ...
|

|
Okay, here's what we'll do. We BUY when the stock goes up U%,
SELL when it goes down
D% ... but if it should go UP another A% after a SELL ... we'll BUY it (so as not
to lose out on a prolonged bull market).
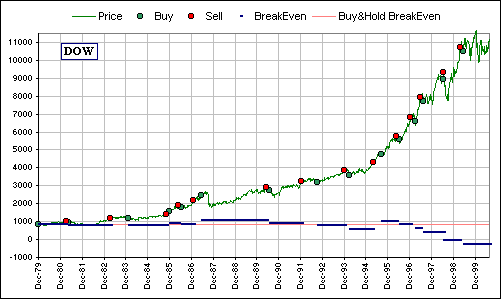
Here's a picture of the situation if we BUY 100 shares
of the DOW with U% = 20%, D% = -2% and A% = 10%.

BUY when stock increases by 20%,
SELL when it decreases by 2%,
BUY (after a SELL)
if it goes up 10% without dropping the prescribed 2%
Things to note:
- The BreakEven has dropped to below $0 ... so we'll make money even if our stock goes
to zero.
- The gaps in the BreakEven graph occur after a SELL
(when we ain't got no stock).
- The BreakEven for Buy-and-Hold is constant at $829.60, namely the original
purchase price of 100 shares at $829 plus a couple of $30.00 transactions (to BUY and to SELL)
giving $82900+$60 = $82,960 which would be recovered if we sold the 100 shares for $829.60
- After the October, 1987 crash things ain't so healthy (comparing our BreakEven
against the Buy-and-Hold BreakEven)
- The chart can be radically different if we choose other values of U, D and A!!
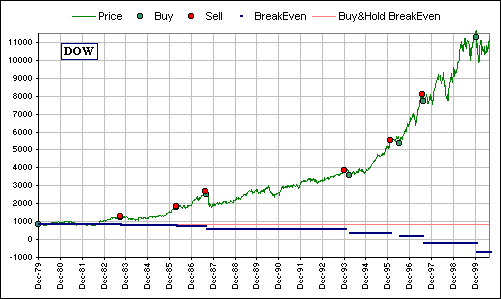
We could, for example, choose U=50%, D=2% and A=5% and get:

BUY when stock increases by 50%,
SELL when it decreases by 2%,
BUY (after a SELL)
if it goes up 5% without dropping the prescribed 2%
If you see only a single point, it's because we bought then sold the next
day so you see only the SELL (or sold then bought
the next day and you see only the BUY).
The two points coincide, graphically speaking.
So, do y'all think this Break_Even strategy is a good one?
>Strategy? What strategy?
Well ... uh, in the last example, we'd have made greater gains. With Buy-and-Hold, the
original investment of 100 shares at about $829.60 (that's $82,960) would result in a
final portfolio of about $1,000,822 whereas the Break-Even strategy would result in
$1,193,045 and that's bigger by $192,223 or about ...
>Okay, but what's the probability of doing that in REAL life?
Probably ... uh ... zero.
>That's what I thought.
|


