| Best Predictors |
Suppose you had info on some stock for the year 2006: from Jan 1 to Dec 31.
What calculations would you make in order to "best" predict the return over the following month: January of 2007?
>Uh ... the Sharpe Ratio?
Possibly. Anyway, I got e-mail suggesting that RSL is a good thing to calculate in order to identify a promising stock.
>RSL?
That's Relative Strength by Levy, named after Robert A. Levy who published a book based upon his PhD thesis ... in the mid 1960s.
You compare the current stock price to the N-day moving average, where N might be 50 or 100 or 200.
In fact:
| RSL = Price / (N-day Moving Average) |
| RSL = Price / (N-day Exponential Moving Average) |
>Exponential Moving Average?
You haven't been paying attention!! Read this.
Anyway, here's a spreadsheet (which is a modification of the one described here):
The Download sheet looks like this: (Click on the picture to download.)

You download a year's worth of stock data (using Yahoo stock symbols) plus 25 days.
Then you calculate a bunch of stuff (like RSL with various values of N or Sharpe Ratio ... or whatever).
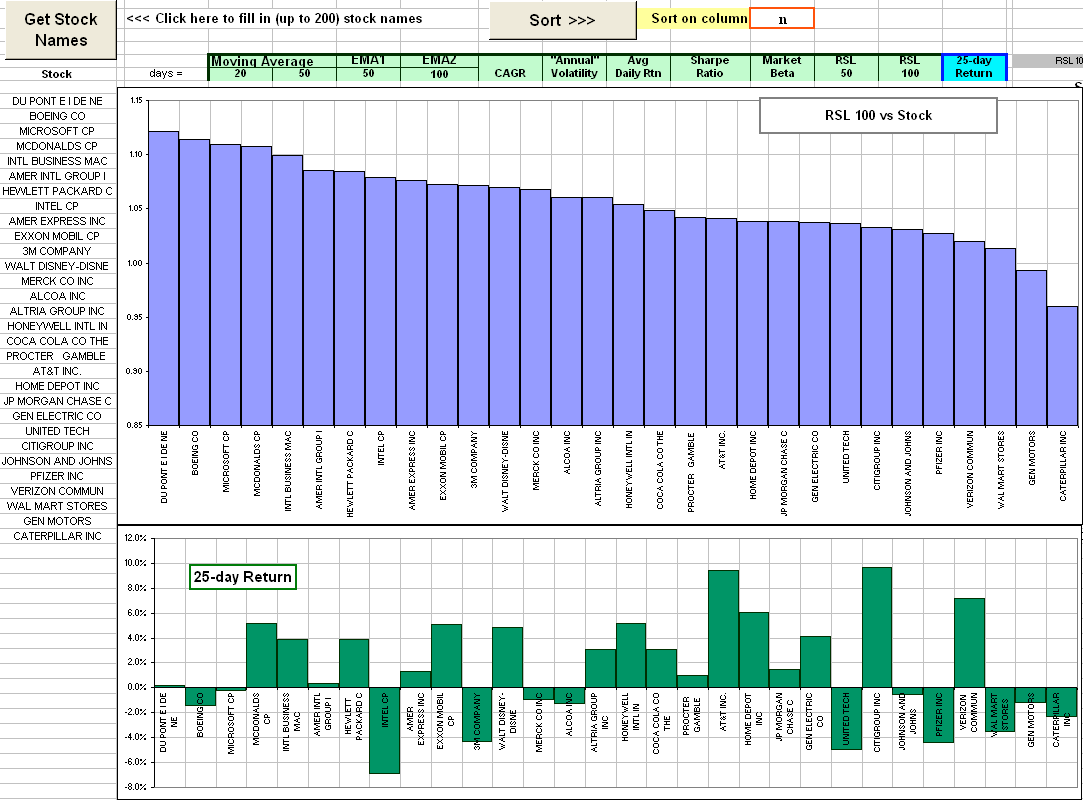
The stuff is calculated for one year .
Then you can sort the collection of stocks according to what you think may be the "best" indicator of how that stock will perform over the next 25 days.
In the above sample, Dupont had the "best" RSL value (with N = 100 days), yet was a mediocre performer over the following month. (Well ... 25 days.)
There's an Explain sheet which looks like this:
 |
>But what if I don't understand Excel and can't make those calculations and ...?
Then you're screwed.

>Okay, so what's the "best" predictor?
Play with the spreadsheet, invent your own "predictors" (like Sharpe Ratio or whatever), then you tell me what's "best" !
|
NOTE:
The spreadsheet changes from day to day as I play with various possible "predictors", like Beta and Williams %R and drawdown and Aroon oscillator etc. etc. For example, I'm considering:
>Okay, so what's the "best" predictor?
However, the one that's most amusing (to me, at least) is using the magic
Using the year 2007 as the base year and the first 25 days in 2008 as the test month, we get this: >Citigroup has the greatest probabiliy, yet ...?
>What about the rest of the 30 DOW stocks?
>Okay, so if YOU wanted to see what might happen next month, what would YOU use?
|
|


)
)