| Volatility: good or bad? |
Suppose you're investing a fixed amount each month and you have a choice between two assets which have the same Mean return ... but one has a lower Volatility (or Standard Deviation).
>I'd go for the lower volatility, so I can sleep nights.
Aah, but can you prove that?
>That's your job. 
Well, it ain't easy ... but I'm workin' on it.
We could assume a particular kind of distribution for the gain factors, keeping the average gain factor the same (as we noted above) then and changing the standard deviation.
>Is that easy?
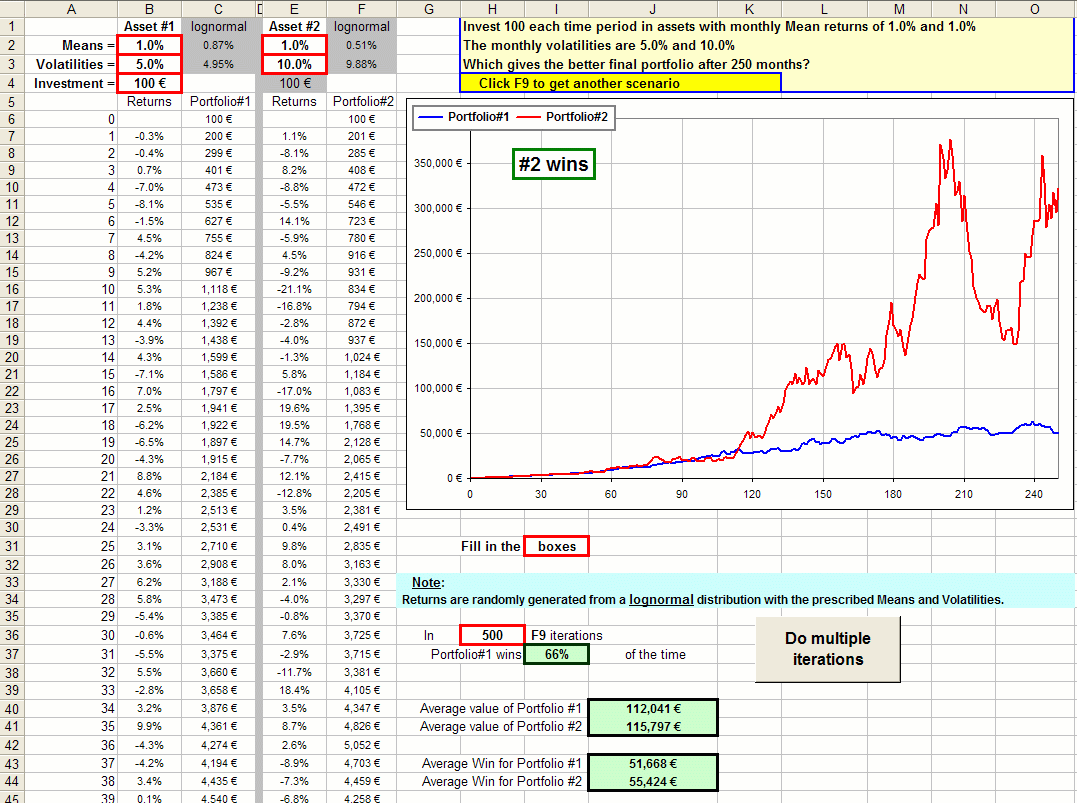
Well ... here's a spreadsheet that'll do that when you specify the Means and Volatilities of two assets. It selects random returns chosen from a lognormal distribution:

Click on the picture to download the spreadsheet.
Each time you press F9 you get another set of 250 monthly returns.
If you get tired of pressing F9 you can click a button and it'll press it for you a bunch of times.
Note that the portfolio is in Euros. 
Note, too, that Portfolio#1 has the lower Volatility (yet the same mean return) and will "WIN" most of the time.
Nevertheless, when Portfolio#2 wins, it wins BIG ... so the average portfolio (after umpteen F9-simulations) is
usually larger for the more volatile asset. 
>And real asset returns are lognormally distributed, right?
Uh ... not exactly.
However, you could download a bunch of historical monthly stock returns, subtract from each their Mean return (which makes the average of the modified returns the same for all assets, namely 0%),
then add some contant return to each, say R%, so now all returns would have the same Mean return (namely R%) ... and their Volatility would not have changed.
For example, this spreadsheet will do this:

Click on the picture to download the spreadsheet.
You enter a bunch of Yahoo stock symbols (30 of them) , click the Download button, pick some Mean return to impose on all stocks and gaze at the cool chart.
>It looks like highr volatility means a poorer portfolio, right?
For this set of assets the tendency is to reduce your portfolio after 250 months ... since the slope of the regression line is negative.
Tha means that there's a tendency for these assets to generate a smaller portfolio if the volatility is larger.
Indeed, the chart of the regression line suggests that a 1% increase in volatility (meaning that x increases by 0.01)
will reduce the final portfolio by $204.71.
>That's peanuts!
For these assets and this time period. 
| Dollar Cost Averaging |
Note that a constant monthly investment is Dollar Cost Averaging.
As noted here, the number of units accumualted after N months is:
|
Number DCA units accumulated after N months is A/P0 (1 + gMS) =
A/P0 (1 + 1/G1 + 1/G2 + 1/G3 + ...
+ 1/GN)
starting when the stock price is P0 and investing $A monthly ... and Gk is the total gain factor after k months. |
Further, the Annualized Return is approximately: (Mean Return) - (1/2) Volatility2.
If the Mean Return stays constant, but we increase the Volatility, we'd expect the gain factors to decrease.
Hence their reciprocals, like 1/Gk, hence gMS, would increase and we'd expect to have more units after k months.
>More units is better, right?
Not is they're worthless! In fact, decreasing the returns would give you more units which are worth less.
In fact, after N months our asset is worth P0GN so we multiply by that and get the value of our portfolio, namely:
|
The value of a DCA portfolio after N months is A GN (1 + gMS) =
A(GN + GN/G1 + GN/G2 + GN/G3 + ...
+ GN/GN)
= A(gN + gN-1+ gN-2 + ... + g1 + 1)
where gk is the gain factor over the last k years. |
>So, is buying volatile assets a good thing?
Not according to my Excel studies ... but I'm not finished yet. 
Besides, the expression above has gain factors, gk,which will tend to be smaller for volatile stocks, so portfolio value would tend to be less.
| Volatility and Trends |
An interesting question one might ask is:
"Does volatility decrease when the stock is on an uptrend (or downtrend)?"
Here's a fun spreadsheet that calculates the moving N-day standard deviation (or "volatility") of a stock so you can stare at the variation in stock price and at the variation in volatility and ...
>And see if there's any correlation, right?
Right:
>So what's the relationship between them?
That's your job. 
However, here's a few more where we've changed the stock and/or the dates:
 |  |
 | 
|

