| Asset Concentration ... a continuation of Part II |
|
We stare at various asset classes, like so and decide (for example) to concentrate our portfolio on Small Cap Value (SV) stocks in the hope that we can capture the returns associated with this class. Figure 1 shows that, for the period since 1928 where the Mean Return was 18.8% and the SD was 32.0% and the Annualized return was 14.2%, we note that, very nearly (see Annualized vs Mean):
>Exactly?
(1+Mean Return)2 - SD2 | 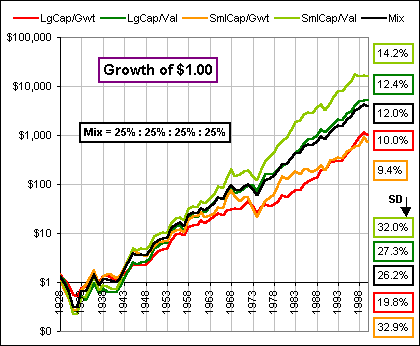 Figure 1 |
so we'll look at SQRT(1.309) = 1.144 and compare to the exact 1+Annualized Return which is 1.142 so the approximation would give 14.4% ...
>Instead of the exact Annualized Return of 14.2%, right?
Right. The approximation is pretty good, eh? We're using:
>What's this got to do with ...?
Asset Concentration? Good question.
What an investor wants is a good Annualized Return. Forget Standard Deviation or Mean Return.
She wants Annualized Return.
|
>But they're related, right? You just said so.
Don't avoid investments just because they have large Volatility (Volatility = SD2) because they could be associated with large Annualized Returns. For example, if we're happy with an 8% Annualized return, then we could invest in a stock (or a basket of stocks) which has a SD of 10% or 20% or 30% or 40% ... so long as the Mean Return increases appropriately, as shown in Figure 2. >Like 8.5% or 9.8% or 12.1 % or ...
>What's this got to do with Asset Concentration? | 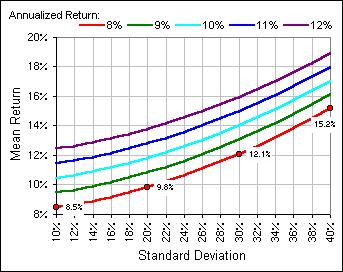 Figure 2 |
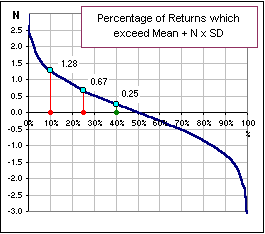 Figure 3 |
Well, let's compare investments that have the same Annualized Return (according to the
Magic Formula), but some have
(High Mean Return & High Volatility) and others have (Low Mean Return & Low Volatility).
If we assume (for convenience) that the returns are Normally distributed, then we'd expect 10% of returns to exceed Mean + 1.28*SD and we'd expect 25% of returns to exceed Mean + 0.67 SD and ... >And 40% to exceed Mean + 0.25 SD ... as per blue dots in Figure 3?
|
(approximately, according to our Magic Formula):
For various C-values this describes a collection of hyperbolas ... as shown in Figure 2.
|
This extra Annualized Return depends upon our choice of Mean and Standard Deviation for our
investments, but it we consider just those assets which give, say, an 8% Annualized
Return then the pertinent curve is shown in red, in Figure 2.
At S = 20%, then M = 9.8% and this combination would give an
Annualized Return of 8%.
>Approximately!
| 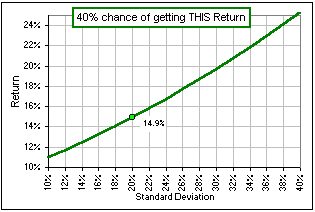 Figure 4 |
>And our chance of losing big-time is greater too, eh?
Sure, but ...
>And I ask again: What's this got to do with Asset Concentration?
Well, we need to pick some percentage, like 40%, and
decide what Asset Class is our best choice ... in order to achieve these extra returns,
40% of the time. Once we identify the Asset Class we put a
BIG fraction of our money into that Class. That's ...
>Asset Concentration?
Why ... uh, yes.
>And does that mean lots of Small Cap Value?
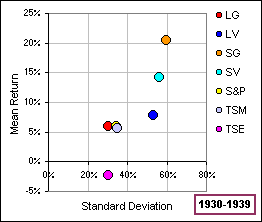
We'll see. In the meantime, stare raptly at these pictures
(where SV means Small Cap Value and
LG means Large Cap Growth and TSM = Total Stock Market and ...
>Yeah, I get it, and I suppose you're talking about "passive" investing ...
Yes, where our portfolio mimics some "Index" which follows some particular asset class and
we expect to get the returns associated with that restricted, concentrated Index and ...
>So, where are the pictures?

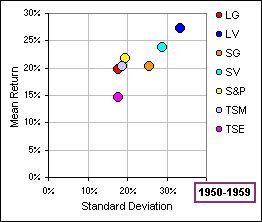

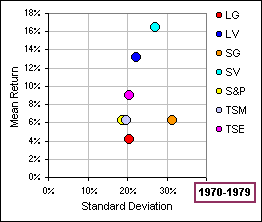
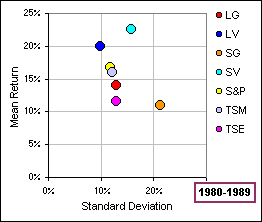
and, more recent stuff:

>So which do you like best? SV or SG or ...?
Well, let's look at which asset class gives the largest value of Mean + 0.25 Standard Deviation = M+S/4.
|
We're not frightened by large volatility but would like to be reassured, when
the volatility IS large, that there's a good chance to make extra gains so we look at
Mean + 0.25 Standard Deviation to see how large that is and
for the last fifty years, we get figure 5: >What's the light blue line mean?
These lines move UP as the percentage increases: 10%, 15%, 20%, etc. The last line (which doesn't lie above the points) is
>So that means SV is best?
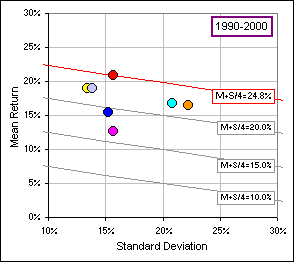 it's been Large cap Growth! | 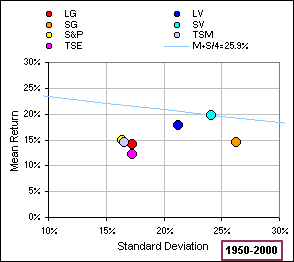 Figure 5 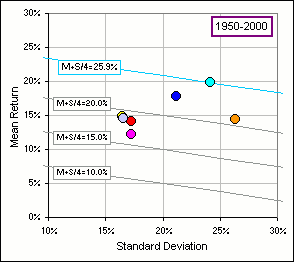 Figure 6 |
>So what's your conclusion?
Uh ... gimme some time to cogitate. In the meantime, see if you can follow the gyrations
of Mean & Standard Deviation (over the previous 10 years) for Small Cap Value:


