| Wilshire 5000 and the GDP |
A while ago I ran across a discussion about whether (or not) the market was overpriced.
>I've seen those discussions. Everybuddy is aways talking about whether ...
Yeah, anyway, there are a jillion numbers one can generate to attempt an answer to this question.
Here we talked about whether the P/E ratio for "the market" was "reasonable/fair", considering its relationship to 10-year bond rates.
Elsewhere we talked about calculating a variety of other ratios in order to ...
>What's your point?
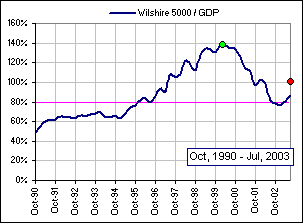
We can generate yet another ratio: (Wilshire 5000 Index) / GDP
>Huh?
|
Apparently it's a ratio that Warren Buffett likes to look at (tho' he uses Total Market Cap instead of the Wilshire Index).
We'll use the Wilshire 5000 Index as a proxy for the market cap of the entire U.S. market. It does, after all, go up and down with the total market capitalization ... >For 5000 stocks, eh?
| 
|
The green dot is at 138%, in March 2000 (when the Wilshire 5K was at a maximum).
>And the red dot?
Guess.
>I give up.
Hint: Today is Feb 2, 2004.
>But where can I find the GDP and ...?
Try: GDP
and Wilshire 5000
>Okay, so what Ratio does ol' Buffett, like?
How about 80%?
See also: WIL5 vs Mkt Cap GDP stuff

