| Value at Risk |
|
Once upon a time I wrote a tutorial on various ways to calculate Risk, like
Another Frontier, where we looked at the
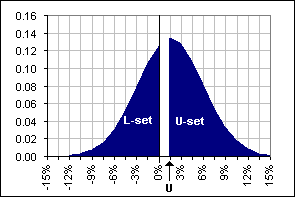
probability of losing money, assuming our Portfolio Returns were Normally distributed. We stared in awe at a chart
as in Figure 1. In particular, we looked at a chart as in Figure 2 where, again ,we recognize a Normal distribution of returns, and
we took the ratio of areas denoted by U-set and L-set. In
Risk reward we even got a formula: 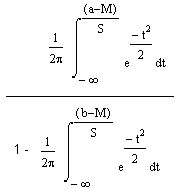 | 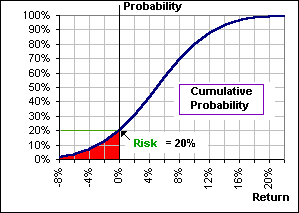
Figure 1
|
>zzzZZZ
Wait! I recently learned that this kind of mathematical stratagem has a name:
Value at Risk
>Huh?
As I understand it, the problem is like this:
You have a Portfolio worth $1,000,000
>That'll be the day!
- You ask: What is the probability that I'd lose $X over the next M months?
- You look at the historical data and extract the Mean and Standard Deviation of Returns (for the components of
your portfolio) and, assuming a Normal Distribution, calculate a theoretical distribution of portfolio values
M months from now ... something like Figure 1 which indicates the percentage of M-month
returns less than R%.
(That example shows that 20% have M-month returns less than 0%.)
(This requires calculating correlations between the returns for the various portfolio components.) - Or, maybe, you do a jillion Monte Carlo simulations (again assuming a Normal Distribution with the Means and Standard Deviations extracted from historical data) and keep track of what percentage of the final portfolios (after M months) are less than $X, for various values of X.
- Or, maybe, you do a jillion Monte Carlo simulations using the actual historical returns (selected at random) and keep track of what percentage of the final portfolios (after M months) are less than $X.
>So?
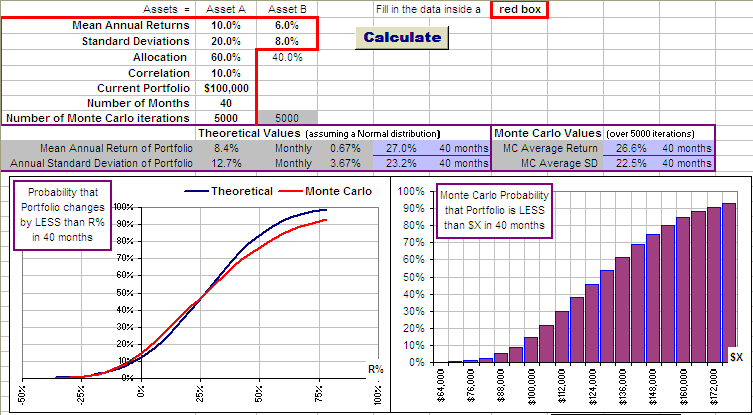
So, here's a spreadsheet which plays this game ... sorta:
>Can I play?
Sure, just RIGHT-click on the picture and Save Target to download a .ZIPd spreadsheet.
However, when I get a chance, I'll change the spreadsheet to let you enter the symbols for a few stocks
(or indexes), click on a button (to download a bunch of monthly returns for the stocks), enter the allocations you'd like
(x% devoted to stockA, y% for stockB, etc.), enter a number of months etc. ... then click on the
Calculate button to get the beeyutiful charts.
>That's technique #4?
No, it's #3.
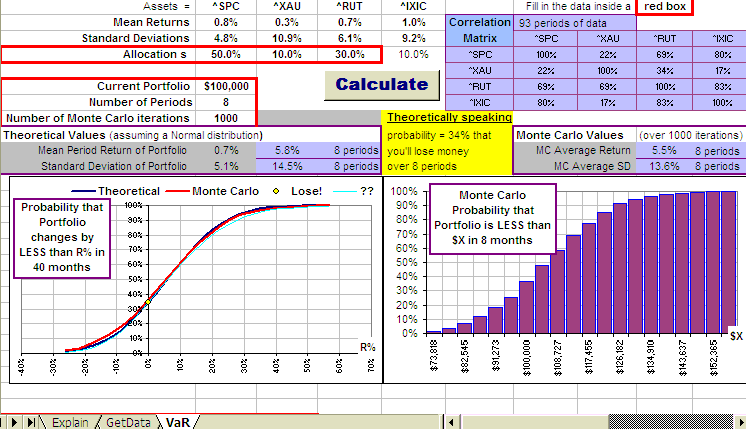
After several sleepless nights (and enlisting the help of
Michael Kishinevsky) I have a spreadsheet
which does Value at Risk
(I think). It looks like this:
You pick four stocks or indexes and ... well, the Explain sheet is here .
Do the RIGHT-click thing on the picture.
>And that's Value at Risk?
Uh ... I think so.
See also :
RiskMetrics
and
in defense of VAR
and
against VAR
and an
interview with Taleb


