| Traffic Lights |
I was told of this software that gave you Buy and Sell signals and ...
>And you bought it, right?
Hardly. It cost thousand of dollars, but in looking at the reviews of the software, I found that people thought the
red and green signals that indicated whether a stock was Hot or Not ... that was neat.
|
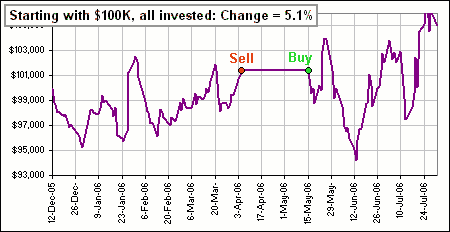
So I decided to give it a try myself, like so:
Yeah. We'll get to that in a moment. |  Figure 1 |
|
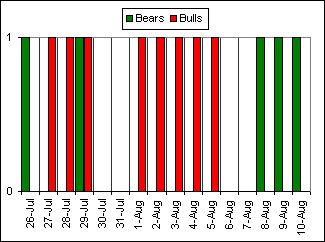
It's that Hot or Not signal that I thought was neat, so you get a Traffic Light, one of the three shown in Figure 2.
>Don't tell me! Green is Buy, Red is Sell and ...
|  Figure 2 |
Yes, like this:

Click the picture to download the spreadsheet
There's an Explain sheet that looks like this and ...
>It does 4 stocks, too?
Yes. There's a 4-Stocks sheet where you can get something like this.
Just type in 4 stock symbols and click the do Four button.
You can change the EMA days and Buy and Sell values to see what'd happen to all four stocks. Neat, eh?
>Yeah. Wonderful, but what on Earth is gBS?
Although I was just interested in generating that neat traffic light, I needed a Buy/Hold/Sell signal, so I decided on gBS.
Let me ...
>What's gBS stand for? I can imagine the g and, come to think of it, I can imagine the BS! 
Let me explain.
| gBS ... Buy and Sell |
The idea is to identify times where the Bulls are just too active and we expect it's time to Sell.
Also, the days where the Bears are too active and it's time to Buy.
To identify these times, we do this:
|  Figure 3 |
|
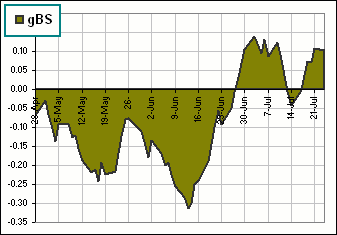
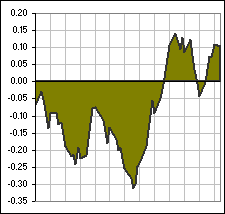
The gBS might look like Figure 4 (similar to the spreadsheet, above).
When gBS is large, we say: "The Bulls have overbought this stock. It's bound to drop, so I Sell."
>And that's it? That's your Buy/Sell signal?
|  Figure 4 |
| gBS details |
Suppose that the sequence of daily Highs and Lows are Hk and Lk for k = 1, 2, ...
We calculate the Bull Points Sk and the Bear Points Bk
... where B and S stand for
Buy and Sell.
We pick N, the number of days in the EMA calculation, and calculate α = 1 - 2/(N+1).
Then we calculate, each day, the Exponential Moving Averages.
Recall the magic EMA formula, namely
EMAk = αEMAk-1 + (1-α) Zk
This implies that we're taking the Exponential Moving Average of a sequence of Zs.
For our EMAs, we calculate:
EMAk[S] = α EMAk-1[S]
+ (1-α) Sk
(the EMA of the Ss).
and
EMAk[B] = α EMAk-1[B]
+ (1-α) Bk
(the EMA of the Bs).
Then comes the difference:
gBSk
= EMAk[S] - EMAk[B]
= α {EMAk-1[S]
- EMAk-1[B]}
+ (1-α){Sk-Bk}
= α gBSk-1
+ (1-α){Sk-Bk}
We recognize that gBSk is just the EMA of the difference: Sk-Bk.
Although we need to assign some value to gBS1, it makes little difference how
we do this.
Since α < 1, after umpteen days, the initial value gBS1 is long since forgotten. 
In the spreadsheet, although a year's worth of daily data is downloaded and used, only the last three months or so is plotted.
In other words, the first nine months serve to get the EMA ritual started. 
>And how would that ritual have done, say at the 1987 crash?
Uh ... I have to find the data for 1987, but remember the terrible Nasdaq (^IXIC) and DOW (^DJI) performance after 1999?
There was great momentum, great hopes of making fortunes (especially in hitech), great ...
>Yeah, so? How would it have done? Would it have warned of the big drop?
You decide:


>But that's cheating! You picked the parameters so you'd get good Buy/Sell signals.
Of course. I always cheat. 
| New Stuff |
|
Since I wrote the stuff above, the spreadheet has changed a wee mite and ...
>You stopped cheating?
>Is it any good?
|  |
That is, instead of comparing daily Highs and Lows we compare daily log(Volume)*High and log(Volume)*Low.
That means that days when the volume of trades were really HUGE have more weight than ...
>Yeah, yeah. I get it.
Good for you.


