|
John M. Templeton ... his maxims
|
motivated by e-mail from Joel M
In 1983, a book entitled The Templeton Touch,
by William Proctor, summarizes Templeton's investment philosophy. They're pretty neat:
- There is only one long term investment objective, maximum total after-tax return.
- Success requires study and work. It's harder than you think.
- Outperforming the majority of investors requires doing what they are not doing.
- Buy when pessimism is at its maximum, sell when optimism is at its maximum.
- Therefore, buy what most investors are selling.
- Buying when others have despaired, and selling when they are full of hope, takes fortitude.
- Bear markets aren't forever. Prices usually turn up a year before the business cycle hits bottom.
- Popularity is temporary. When a sector goes out of fashion, it stays out for many years.
- In the long run, stock index prices fluctuate around the EPS trend line.
- Stock index earnings fluctuate around replacement book value for the stocks in the index.
- Buy what other people buy and you will succeed or fail as other people do.
- Timing: buy when short term owners have finished selling and sell when they've finished their buying, always opposing the fashion.
- Stock prices fluctuate more than values. So stock indexes will never produce the best total return performance.
- Focus on value because most investors focus on outlooks and trends.
- Invest worldwide.
- Stock price fluctuations are proportional to the square root of the price.
- Sell when you find a much better bargain to replace what you are selling.
- When your method becomes popular, switch to an unpopular method.
- Stay flexible. No asset or method is forever.
- Stock market investing takes more skill than any other kind of investing.
- A person can outperform a committee.
- If you begin with prayer, you will think more clearly and make fewer mistakes.
|
> #16 is interesting, eh?
Yes ... we should investigate.
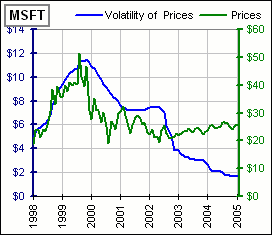
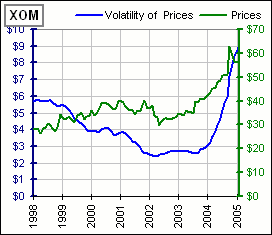
We'll look at the last ten years of GE monthly stock prices and, for each month:
- Make note of P = The closing stock price for the month.
- Calculate SD = The standard deviation of the previous three years of monthly prices. (That's 36 prices.)
- Plot SD, P, SD versus P and SD versus SQRT(P)
... the last two being scatter plots:

>How come the chart starts in 1998?
For 1998 I calculate the volatility of monthly prices from 1995, 1996 and 1997. That's three years, eh?
>Well, it don't look good. Maybe Templeton's "fluctuations" doesn't mean the standard deviation.
Yes ... maybe.
>Maybe it don't work good for GE. How about ... ?
I tried several stocks ... not a good fit. If they were "proportional", you'd expect price-volatility and price to go up and down together.
Once upon a time I played with stock price volatility
here
(at the suggestion of John Bollinger) and
(on the basis of some sloppy math),
concluded that the volatility of stock prices are more likely to be proportional to the product of the stock price
(rather than the square root of the price) and the volatility of the stock returns.
>And you're sure of that?
Hardly ...

| 