| Reversion to the Mean |
I was thinking about that Reversion to the Mean stuff, that's RTM, and ...
>And?
Well, I really don't understand what it means. What's doing the Reversion ... and to what Mean?
>I'd say that if there's been great market returns in the recent past then ...
Then there'll be lower returns in the near future, eh?
>Now you've got it!
So you're talking about, say, monthly returns?
>Sure. Why not?
And what Mean are you talking about? Some historical Mean?
>Sure. Why not?
Okay, let's look at the last 50 years or so of the S&P 500. Here's what we'll do:
- For each year (from 1950 to 2002) we'll calculate the average monthly return. We'll colour them blue.
- For each decade, the 1950s, the 1960s, etc., we'll calculate the average monthly return (over ten years) and colour it magenta.
- Finally, we'll calculate the average monthly return over all 53 years from 1950 to 2002. We'll colour it red.
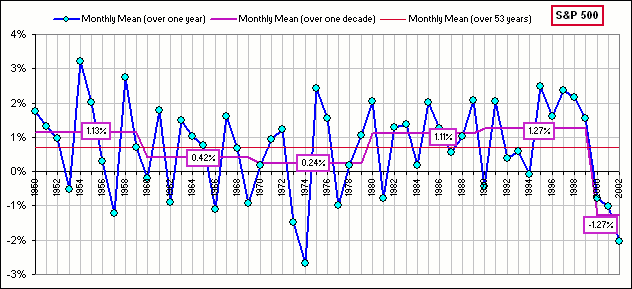
Figure 1
>For each decade? Years 2000, 2001 and 2002 don't hardly constitute a decade.
Okay, I lied. That's not a decade.
However, I want you to stare at the chart and tell me how, given the
data over some previous year, you could predict how the monthly returns might behave for the next decade.
>Huh?
Look at the monthly returns over, say, the 1960s. They average 0.42% over that 10-year period. That's low
compared to, say, the 1950s.
It's January, 1970 and you say to yourself, according to RTM ...
>I'd say the returns will improve!
Do they?
>I give up.
Me too. Note that they did go up for three years: 1970, 1971 and 1972 and then ... BOOM !
>So maybe RTM is talking about the long haul, like the whole decade.
During the 1970s the average monthly return was worse than the 1960s ... just 0.24%
>So would RTM be talking about the 1980s or 1990s?
I give up.
>Is RTM talking about annual returns?
I give up.
>Maybe RTM is talking about stocks, not an Index like the S&P 500.
Maybe, and maybe RTM is talking about a mathematical ritual (as opposed to real live returns).
|
>Huh?
If you assume that the monthly (or weekly or annual) returns are selected at random from some distribution of returns, that distribution having a fixed Mean, then if you pick a random return from this distribution and it's far from the mean, then chances are the next selection will be closer to the Mean. That's clear from probability theory and ... >There you go! Reversion to the Mean, eh? And you're happy with that? I mean, you just accept the mathematical machinations that dictate Reversion? >Sure. Why not? Good for you. |  Figure 1A |
See what you can deduce from this:
Figure 2
I guess I should point out that RTM suggests that, after a sequence of good returns you should expect
some bad ones. For example, suppose you flip a coin and every time it comes up heads you get a positive
return and if it comes up tails you get a negative return. After ten heads (hence ten good returns) then
you should really be prepared (and expect) a negative return.
>According to RTM, eh?
Yes. However, if there is zero correlation between successive returns (which would be the case for the
coin tossing scenario), then there's just a 50% probability of a negative return (the same as for a
positive return) ... and that's independent of past returns.
>I guess that violates RTM and ...
Yes. With RTM, after some really bad returns you should expect some good ones.
>So what do you think? I mean, about RTM.
I think it has nothing to do with probability theory or mathematical gesticulation but rather it's a
consequence of investor sentiment. If there has been a gaggle of bad returns, investors say
things like: "The market is oversold" or maybe "We've reached the bottom" or maybe ...
>So they start buying.
Yes, and the market recovers. On the other hand if the market has had spectacular gains then investors say ...
>"The market is overbought" or maybe "We've reached the top" or maybe "It's time to take profits" or ...
Exactly.
>And the gurus call this ...
Reversion to the Mean.
>And don't you think that RTM is a way to express investor behaviour?
Yes, I suppose ... but I'd be happier if the gurus recognize this and stop implying that it's a
consequence of some esoteric mathematical ritual that nobuddy should question because the math is too difficult
for the average Joe ... like:
Reversion to the Mean is the statistical phenomenon described by

... or maybe

... or maybe 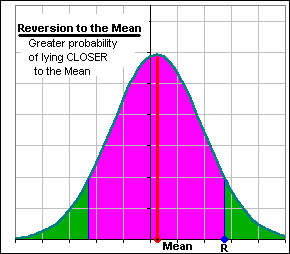
>Is that wrong?
No, of course not. It's okay in a statistics textbook.
But to say that some historical mean determines the future behaviour of stock returns according to some mathematical hand-waving ... that's dreaming.
My point is that, when financial experts use RTM, they should say that it's an attempt to model investor behaviour.
>Then you'd be happy?
Well ... happier.
>Good for you.
