| R-squared Stuff ... a continuation of best Line Fit |
Okay, here's what we read, again and again about the infamous notorious very useful R-squared
(sometimes called the Coefficient of Determination).
A statistical measure that represents the percentage of a fund's or security's movements that are explained by movements in a benchmark index.
For fixed-income securities the benchmark is the T-bill, and for equities the benchmark is the S&P 500.
R-squared values range from 0 to 100. An R-squared of 100 means that all movements of a security are completely explained by movements in the index.
>R-who?
You've forgotten already?
Remember the Pearson Correlation r?
r = COVAR[x,y] / SD[x]SD[y] = {M[xy] - M[x] M[y]}/{SD[x]SD[y]}
= (1/n) Σ (x - M[x]) (y - M[y]) / {SD[x]SD[y]}
where M[x] stands for the mean of the set of returns denoted by x, SD[x] their Standard Deviation and COVAR[x,y] the Covariance between two sets of returns.
>And Σ means you add 'em all up, eh?
Yes ... and R-squared = r2.
Now here's where that statement, above, comes from:
It sort of measures how closely the points lie on a straight line. If R-squared = 1, for example, then all the points lie on that line. When R-squared is close to 1, we assume that the behaviour of the y-values is, at least in part, determined by the x-values. If the x-values are Market Returns, say the S&P500 as a benchmark, we're tempted to say (when R-squared is close to 1) that the y-values are following the market. Indeed, we're tempted to say things like ... | 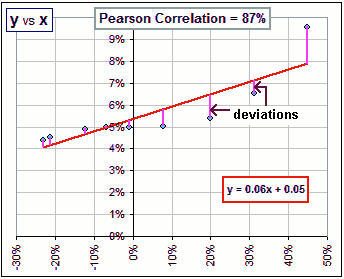 |
Yes, that's what we're tempted to say. In fact, for the situation in the picture, R-squared = 0.872 = 0.76
So we might conclude (with many others) that 76% of the asset's movement are due to market fluctuations and ...
>And the rest, 24%, is due to ... what?
If the x-values are the S&P returns and the y-values are my portfolio returns, then the 24% is due to my extraordinary trading skills.
If the y-values are the returns of, say, Ford Motors or Exxon, the remaining 26% may be due to the price of gasoline.
If the y-values are ...
>In other words, for large R-squared, much of the fluctuations in the y-asset is just due to market fluctuations, right?
If the x-values are Market Returns ... then that's what they say.
|
>Just because the Error is 0 when R-squared = 1, why would one say that R-squared gives the percentage of movement due to the benchmark?
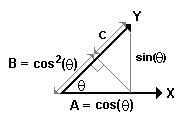
Remember when we talked about the two vectors that describe the two assets, here? X has components (xk - M[x] ) / SD[x]√n and Y has components (yk - M[y] ) / SD[y]√n. They each have length equal to "1". That is, ||X|| = ||Y|| = 1. The component of Y in the direction of X is cos(θ) and that's the Pearson Correlation r. So, staring at the diagram on the right, what fraction of Y is due to the influence of the benchmark vector X? >Is it the vector A ... with length cos(θ)? No, it'd be the vector B with length cos2(θ). Note that the lengths B + C add up to "1", the length of Y. >I assume you got B = cos2(θ) with some trigonometry bumpf, eh? Yeah ... so what've we got?
|  |
>And you believe all this stuff, eh?
Of course!
Here are some more examples and I'll let you draw your own conclusions:
- The R-squared between sunspot activity and the S&P 500 is ...
>C'mon! You're not telling me that sunspots are influenced by the S&P500?
Well, maybe S&P returns are influenced by sunspots ... ever think of that?
Anyway, continuing:
- The R-squared between Microsoft returns and the length of women's skirts is ...
>zzzZZZ

Okay, so here are some excerpts from other applications that I found, for investigating "causal" relationships using R-squared:
>Okay, I get the idea.
Good for you. 
Here's something neat.
|
Let i be an operation peformed on vectors which lie in the plane of X and Y.
The effect of applying the i-operation is to rotate a vector counterclockwise by 90 degrees. In the diagram on the right, we see some vector V as well as iV and i2V. >I assume that i2V is the result of applying ...
|  |
Very much like -V! In fact, it's exactly equal to -V. That is: i2V = -V so i2 = -1.
>Are we talking complex numbers here?
Why not? We just put i = √(-1).
|
Now look again at an earlier picture ... which I'll repeat here, for convenience >That ain't the same picture!
| 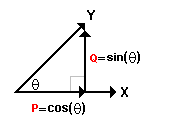 |
Note that, since the length of vectors X and Y equal "1", then P = cos(θ)X.
That is, it's in the direction of X and had length cos(θ) ... since X has length = 1.
>Don't tell me! Q has length sin(θ), right?
Actually it's left ... or, to put it differently, it's in the direction of "X rotated 90 degrees left", so
Q = sin(θ) iX.
Now, since Y is the vector sum of P and Q, that is: Y = P + Q, we get:
| Y = ( cos(θ) + isin(θ) )X = exp(iθ) X |
Isn't that neat!?
| Berkshire-Hathaway |
Since we're talking about correlations and stuff, while I was reading this
article by Geoff Considine ...
(Geoff does a really neat analysis of Warren Buffett's BRK holdings.Why is ol' Buffett so successful, eh?)
... anyway, I was thinking "correlations".
>Yeah? So what else is new?
Here's collection of correlations for the top 20 holdings, as noted in the article:

What's interesting is the low correlations between these holdings.
>Is that good?
Well, sure. Diversification ya know. You should diversify across assets with low correlation in order to reduce portfolio volatility.
>And that Berkshire stuff, does it have low volatility?
Read the article yourself! You should learn to do things for yourself! Use your cerebral prowess! Why do I always have to ...
>Did you know that your chart is called Birkshire-Hathaway.gif? You can't even spell it right!

