| Deletion of Max and/or Min Values |
One often runs across articles that talk about what'd happen if you missed the umpteen best or worst days (weeks? months?) on a stock and ...
>Haven't you done that before?
Yes, sorta, here.
But the reason why one would drop the best or worst depends upon what you're trying to demonstrate.
This article
(in PDF format) intends to show that
large changes occur more often than one would get by assuming, say, a Normal distribution of returns.
(The article promotes the teaching of
fractals to students of finance.)
Anyway, whatever the reason for looking at this, I thought it'd be neat if one could download, say twenty years of daily prices, then delete the best or worst daily returns, one-at-a-time, and see what'd happen to the chart of prices and ...
>Example?
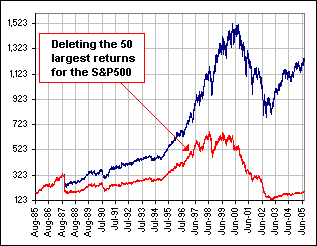
Okay. If we look at twenty years of daily returns for the S&P500 and delete the largest daily change
(either positive or negative),
then the next largest, then the next ... for, say four such deletions, we'd get
this.
The red
graph is the S&P with the largest daily returns replaced by 0% returns ... one-at-a-time.
>Aha! I see that that nasty October, 1987 is the first to go, right?
Yes, after that first deletion, the dip in the red graph vanishes in Oct/87.
>But what about deleting just the maximum returns, one-at-a-time?
Yes, or maybe just the minimum returns, one-at-a-time.
>Yeah, so?
You can play with this spreadsheet:

Click on the picture to download the spreadsheet.**
You type a Yahoo stock symbol, click the Download Data button, then choose one of three buttons:
Delete Max (which deletes the Maximum return with each click),
Delete Min (which deletes the Minimum return with each click),
Delete Largest (which deletes the Largest return, whether positive or negative, with each click)
In fact, if you click Delete Largest ten times, you'll get a chart like the one shown in the article I noted above.
|
If we delete the 50 Maximum returns from the 5000+ daily returns downloaded, we see that the 550% total return
(over the twenty year period) has been reduced to 0%.
>So you should never get out of the market, right?
>Exactly!
|  Figure 1 |
| >So what's with that article you mentioned above?
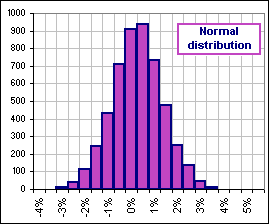
I told you already! Large changes occur more often than one would get by assuming, say, a Normal distribution of returns. For example, if we take those twenty years of real, live daily 5000+ S&P500 returns and delete the ten largest returns (replacing them by 0% returns), you get a significant change in the graph. However, if we select the 5000+ returns from a Normal distribution (with the same Mean and Standard Deviation as the real, live S&P ... as in Figure 2), and we ... >And delete the largest ten from that fictitious, Normal collection, you get what? |  Figure 2 |

>Not too different, eh?
For the Normal distribution? Yes, and that's the point of the article.
Remember this picture?

>No.
Then you should've read that fractals link I gave you earlier !^#$@!*&!
Which one is the real, live set of returns for GE stock and which is generated from a Normal dfistribution?
>I give up.
Then read about fractals !!
>About that spreadsheet ... it does all this?
No, it just does what I said above:
You type a Yahoo stock symbol, click the Download Data button, then choose one of three buttons ...
>Yeah, yeah ... and you guarantee that it works?
Don't you know anything? I offer a money-back guarantee! 
**
The spreadsheet is over 1.5 MBytes 'cause it's got tens-of-thousands of downloaded stuff.
Once upon a time I would stick a .ZIP'd version on my website, but these days everybuddy
(except me!) has fast internet access ... 
See also risk stuff.
