| Money Flow Index |
I always wondered how people measured momentum. When a stock price is on the move, upwards, maybe it's time to buy and go along for the ride and ...
>Or on the move down, eh?
Yes, of course. But what does it mean ... this "on the move" stuff?
>Momentum?
That's what it's called, but it's measured in so many ways and may involve so many factors and ...
>For example?
- Strong upward trend in the price chart and greater than expected earnings growth.
- Strengrh, relative to other stocks (or "the market" as a whole), measured (perhaps) by the Relative Strength Index. (See RSI, here.)
- The market goes down, but your stock doesn't ... so it may explode when the market starts up again.
- Don't hold on to a falling stock ... and look for one that stays above its 50-day moving average.
- Small cap, low volume, less liquid stocks can make explosive moves.
- Look for new highs before the stock goes even higher.
- Keep your eye on the Directional Movement Indicator and ADX and ...
|
>DMI? Didn't you play with that some time ago?
Yes, here and here. In particular, I was interested in weighting the stock price according to the volume of trades associated with that price. A day when a million shares traded is more significant than a day where a hundred thousand traded, so I volume-weighted the prices and called the "modified" value of ADX ... >VDX?
>So I should buy that COS-UN stock?
| 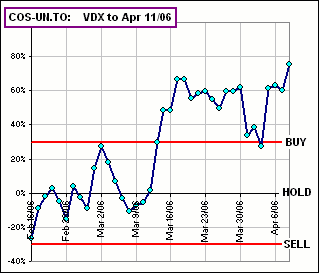 Figure 1 |
Remember that, if RSI = 0.75, then you'd say: "The price has increased 75% of the time, over the past umpteen days".
Now, RSI, when volume-weighted, is called ...
>Money Flow Index?
Very good! You've read the title, eh?
The idea is this:
- Consider some representative daily price, say P = (High + Low + Close)/3 ... a daily "average" price
- Multiply P by the volume for that day giving P*V ... representing the value of all the day's trades, hence the daily "Money Flow"
- Keep track of the Money Flows on those days when the price went UP, calling them "Positive" Money Flows
- Add ALL the volume-weighted prices for the past umpteen days ... giving the total "Money Flow" over this time period
- Add up all those "Positive" Money Flows ... summing the "positive" volume-weighted prices over the past umpteen days
- Determine the ratio: MFI = (SUM of positive Money Flows) / (SUM of ALL Money Flows)
You can say that if you like. It don't hardly matter to me.

>So where's the spreadsheet?
Just click on the picture:

>And what do I look for?
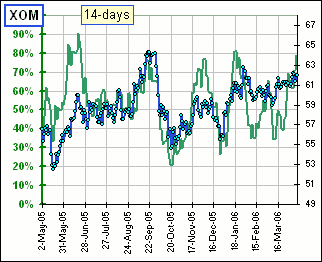
I'd suggest playing with the spreadsheet, for various stocks, and seeing if, for example, large values of MFI (like 80% or better) indicate that you've reached
a maximum stock price or maybe small value (like 30%) means you're at a minimum or maybe ...
>And that's it?
That's it for me! ... but here's a few (for cogitation purposes): 
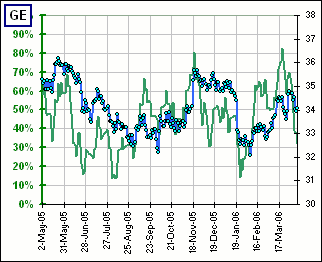
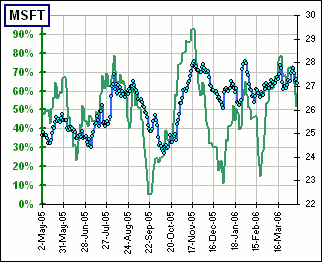

... and what happens when you change the number of days:
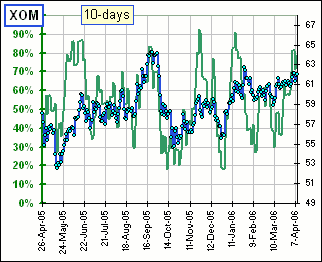

>You call that "momentum" investing?
Who me? No, I don't ... but maybe this is closer to momentum.
