| the Levy distribution |
Suppose that:
- The price of a stock is P(t), at time t.
- Suppose, further, that the next price (at time t+1) is randomly distributed.
- Suppose that the distribution of possible price changes (at time t) has some (as-yet-unknown) distribution.
It has also been observed that the change may be very large.
It has also been observed that ...
|
>Okay! Not Normal ... hence abnormal, right?
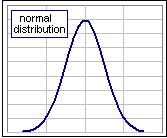
Patience. Remember what the garden variety Normal distribution looks like? >That's the probability density function and S the Standard Deviation, right? |
|
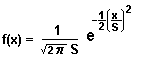
Yes, with Mean = 0. Now let's suppose that S, the Standard Deviation, is a function of x, like so:
| [L1] S = x3/2 / c1/2 where c is some parameter. |
|
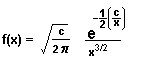
Then that Normal distribution changes its personality ... and looks like so: |
|
|
and so (Figure 1): That distribution has a name and its ... >Levy!
>So why that strange transformation [L1].
| 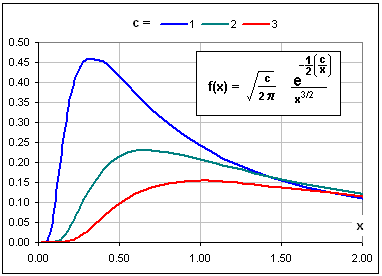 Figure 1: Levy distribution |


|
Once upon a time I was staring at the stock prices for XOM. They looked like this: See? The volatility (or Standard Deviation) changed dramatically. That characteristic implies that assuming some constant Standard Deviation is way off base. That leads to something called the Hurst Exponent. That leads to ... >But you never finished that Hurst Exponent tutorial!
|  Figure 2 |
|
Anyway, let's assume that the Standad Deviation for the gains increases when the gains are large.
In fact, let's assume that:
>I assume you mean you'll stick this S into the Normal formula.
Anyway, if we vary α (as in Fig. 2) we get lots of possible distributions. Of course, to be a valid density distribution, we'd need to have: | 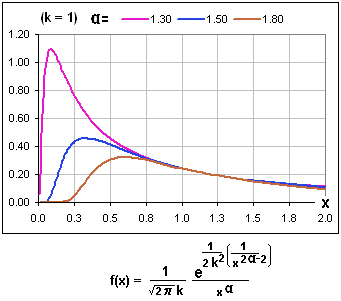 Figure 3: modified-Levy distribution |


>And that restriction is ... what?
I have no idea. 
Note, however, that the blue curve in Fig. 2 is the same as the blue curve in Fig. 1.
(
They got k = c = 1 and α = 3/2.
| Checking Levy |
Note that, in the above discussion, the values of x are positive.
We assume they represent the gain factors for some stock. That is, if the stock return is 8.2%, then the corresponding gain factor is 1.082.
Then, unless we have returns less than -100%, our gain factors will be positive. (Let's just call 'em "gains", okay?)
Okay, let's first consider the daily gains for that XOM stock that we noted earlier (in Figure 2).
|
For the past 10 years, the stock performance looked like this: We look at the distribution of the 2500 daily stock gains. They look like this: 
| 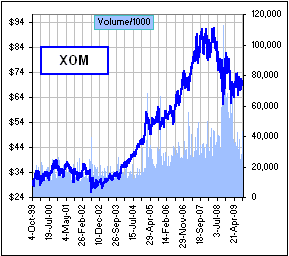 Figure 4 |
>Is that Levy?
It don't look like Levy, eh?
Let' try some others (over the same time period). Here, we'll use bar graphs ('cause f(x) dx gives the number of gains in some small interval).
>And you like to show the interval, right?
Yes ... and because the charts look more sanitary.
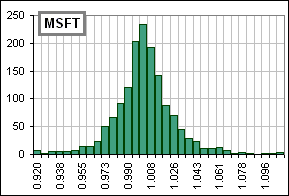 Microsoft | 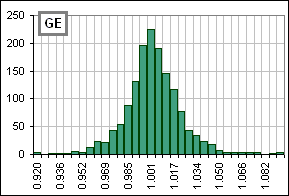 General Electric | 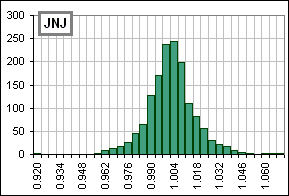 Johnson & Johnson |
|
In fact, the cumulative probability looks even more sanitary: >Cumulative?
>And that means less than 2.5% daily return.
| 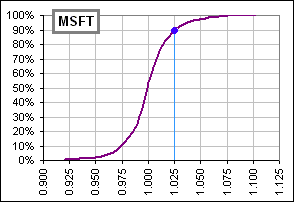 Cumulative Distribution |
