| Gain-Loss Spread |
We talked a lot about measures of Risk and ...
>It's standard deviation, right?
That's one (lousy) way to measure risk, but there's also
Value at Risk and Drawdown
and Coherent Risk and other Assorted Variations and
>So?
So there's this neat paper where the author defines a new measure of risk like so:
- You look at a bunch of monthly returns. (Example: The last 10 years worth.)
- You see what fraction p, are non-negative (Example: p = 52.9%)
- You calculate the Mean of those non-negative returns: G% (Example: G = 3.13%)
- You calculate the "Expected" non-negative return: p G (Example: p G = (52.9%)(3.13%)= 1.67%
- Then you repeat for the other, negative returns:
q% negative returns with a Mean of L% hence an Expected negative return of (q%)(L%)
(Example: q = 47.1% negative returns with a Mean of L = -3.33% giving an Expected negative return of (q%)(L%) = (47.1%)(-3.33%%) = -1.57%
>Don't tell me! You add them together, right?
Wrong. You want the difference between the expected Gain and the expected Loss and that's their difference: GLS = pG - qL
In our example, that'd be: GSL = (1.67%) - (-1.57%) = 3.24%.
See how it works?
>What's GLS?
The Gain-Loss Spread.
>Where's the spreadsheet?

| GLS and Omega |
Some observations:
Yes. That's the density distribution and the entire area beneath the curve is 1. In other words, p + q = 1. The area to the left of 0% is the percentage of returns which are less than 0%. [A] That'd be: q = ∫ f(x) dx where the integration is from -∞ to 0. >Wake me when you're finished ... zzzZZZ. | 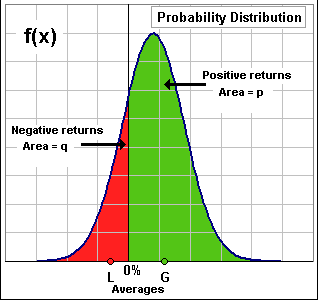 |
|
Now consider the Cumulative distribution F(x).
F(x) gives the area under f(x), to the left x. As x goes from -∞ to +∞ , F(x) ranges from 0 to 1.
Not quite. For example, I1 = ∫ F(x) dx where the integration is from -∞ to 0. This integral can be written as: I1 = - ∫ x f(x) dx. (We've integrated by parts, where the "part" [F(x) x], evaluated from -∞ to 0, is 0.) The average negative return would be: L = ∫ x f(x) dx / ∫ f(x) dx. Recalling [A] we have: I1 = - q L. >Don't tell me! The green area is pG, right?
|  |

Anyway, we now have: GLS = pG - qL = I2 + I1.
The interesting thing is that these two areas, I1 and I2, occur in the definition of Omega.
Indeed, Omega = I2 / I1. See? Omega uses the ratio rather than the sum. Isn't that interesting?
>Uh ... yes ... fascinating. 
Okay, one thing that's really nasty about using Standard Deviation as a measure of "RISK" ... it doesn't change when you add 10% to all the returns.
At least, with both GLS and Omega, adding a constant return changes them both.
>That's what you'd want for something called "RISK", eh?
I would. In fact, adding a contstant return will just shift the distribution to the right and that tends to increase both GLS and Omega
... but not always. Check out this spreadsheet 
| What's "RISK"? |
|
Okay, let's stare intently at the moving distributions, both density f(x) and cumulative F(x): >And all them areas, eh?
>Because all returns are being increased, right?
| 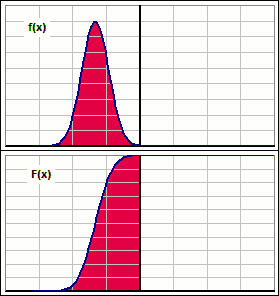 Figure 1 |
|
We also gaze at the following picture. It illustrates pertinent numbers we may want to incorporate into our definition. >But I don't see the Standard Deviation?
|  |


But it could be infinite if p is 0. See the all-red situation, in Figure 1? p = 0 there.
How about ...?
|
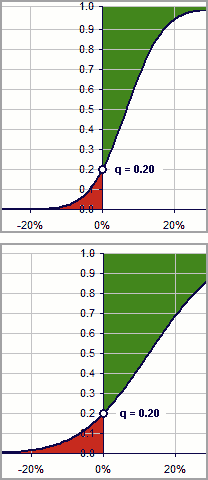
>Wait! I pick q, all by itself. It goes from q = 1 to q = 0 as the returns go from all-negative to all-positive. Good, eh?
Uh ... look at these two distributions. They have the same q-value, namely 0.20 or 20% and that means ... >That means that 20% of the returns are negative ... for both distributions.
>Uh ... one of them, the bottom one ... it has a lot more of them really negative returns.
>So we gotta include the "spread" of returns ... somehow.
>I got it! RISK = q * (Standard Deviation). How 'bout that?
>Okay, how about ...?
|  |
We suppose we have a collection of returns and wish to define RISK.
It'll be computed from that collection of returns. What characteristics should it have?
| 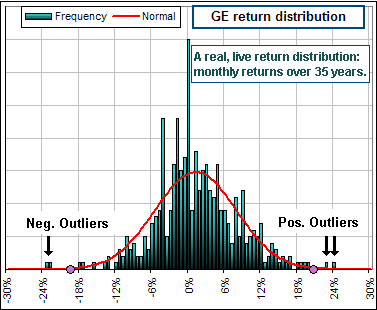 Figure 2 |
See the wee dots on the x-axis, in Figure 2? They're 3 standard deviations from the Mean return. Beyond that, returns should be very rare.
For those GE returns, there are 10x the number of outliers that you'd expect from a Normal distribution.
>Okay, so what RISK definition do you suggest?
I'm thinking. Let's see ...
RISK = function(p, q, G, L, outliers, standard deviation, unknown variables, phases of the moon, ...) 
If we just include negative outliers, left of the y-axis, then when they shift right ...
... maybe we should weight the negative returns by how far to the left of 0 they are
... uh ... we may have to give up having our RISK lying between 0 and 1 ...
|
>Yeah, but where's the cumulative distribution for those real, live GE returns, and p and q and ... ?
Good question. They look like this: >Huh? You mean that ragged f(x) distribution for GE, in Figure 2, looks that smooth in Figure 3?
>Okay, so what RISK definition do you suggest?
| 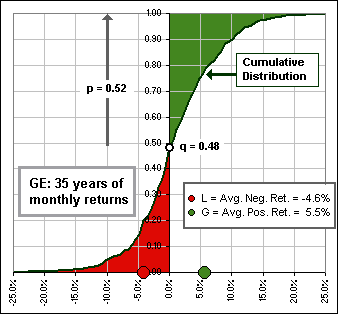 Figure 3 |
- Suppose the negative returns are R1, R1, ... Rm.
- Their average is: A = (1/m) ΣRk. (That's a weighted return where all the weights are equal to 1 and the sum of weights is m.)
- If they're weighted by how far they are from 0, then outliers would play a bigger role. The weights would be: | Rk |.
- The weighted average (or Mean) is then: M = Σ| Rk| Rk / Σ| Rk|.
We multiply each return by the weight and divide by the sum of weights. - But all them negative returns are ... uh, negative, so we can write this as: M = Σ Rk2 / ΣRk.
That's the same as: M = (1/m)Σ Rk2 / (1/m)ΣRk and the guy on the bottom is the garden variety Average of the negative returns. That's A. - Now the Standard Deviation of the negative returns (a sort of "downside" standard deviation) satisfies:
SD2 = (1/m)Σ Rk2 - {(1/m)ΣRk}2.
That is, SD2 = (average of the squares) - (square of the average) ... as noted here. - Hence and therefore (I love that phrase!): M = { SD2 + A2} / A.
- Now we can ...
>Wait! What if there are no negative returns. Then what's A?
It'd be 0, but don't worry about dividing by 0. The numerator is also 0 and is smaller than the denominator 'cause it's got squared returns.
In other words, as the negative returns approach 0, their average will approach 0 ... but so will their standard deviation.
>But isn't A the same as L, the "ordinary" average of negative returns?
Aha! So it is! 
|
Then let's rename our newest variables like so: >Where are you going with this?
|
|

If we're considering just a particular x-interval (like x > 0), we divide everything in sight by ∫ f(x) dx integrated over that interval.
Normally, ∫ f(x) dx = 1 over = -∞ to +∞.
For the GE example in Figure 3, the mean of negative returns was L = -5.6%. The weighted mean was M = -8.2%.
The mean of positive returns was G = 5.5%, whereas the weighted mean was M = 9.7%.
>It's them outliers, eh?
Seems that way, don't it?
|
RISK Geometry
|
|
Here's something interesting. Suppose we want to determine the centroid of the area shown Each wee vertical strip has area: (1 - F(x)) dx. The moment about the vertical axis is then: x (1 - F(x)) dx. The total moment of the entire area is then: Moment = ∫ x (1 - F(x)) dx (the integration being from x = 0 to x = ∞). Then, integrating by parts, Moment = [ (x2/2) (1-F(x))] + (1/2)∫x2 f(x) dx = (1/2)∫x2 f(x) dx where the first part, evaluated between 0 and ∞, is 0. | 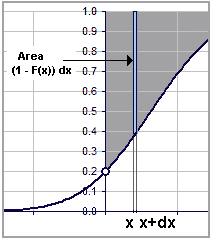 Figure 4 |
|
Using [B2], we see that:
[B3]: Moment = (1/2) [ SD2 + M2 ] ∫ f(x) dx But the centroid is: Moment / Area and the Area is: ∫ (1 - F(x)) dx = [ x (1-F(x))] + ∫x f(x) dx
Using [B1], we see that:
| 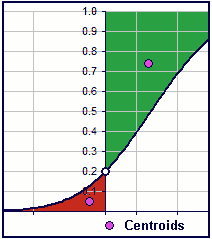 Figure 5 |
|
>Hey! Ain't that them weighted average return things?
Yes ... and that's fascinating, eh what? The magic formula [SD2+M2]/M looks funny, but it's just the centroid. >It's twice the x-coordinate of the centroid.
>So what's the y-coordinate of the centroid?
>Uh ... no. Can you?
| 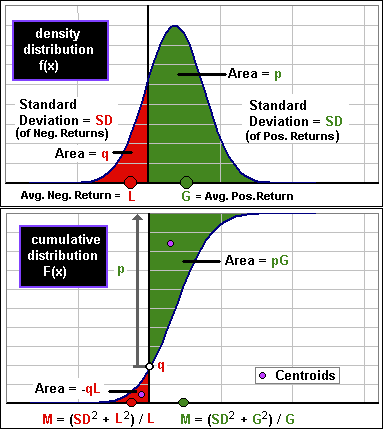 Figure 6 |

