| FOREX trading |
After dinner Marty talked about trading in Foreign Exchange rates and, although I had written a spreadsheet to download exchange rates, I didn't know anything about trading ...
>Huh?
You buy, for example, Japanese Yen ... thinking the Yen will go up against the U.S.Dollar
If the exchange rate is currently 110.40 then changes in a week to
110.32 you sell and make a few pips.
Remember that you want to buy the Yen when it's low in terms of the currency you're using to buy.
For example, suppose you're buying with U.S. dollars.
You Buy Yen when 1$USD will buy 110.40 Yen.
You then want to sell when the Yen is high.
For example, when1$USD will only buy 110.32 Yen
meaning the conversion from Yen back to $US will make you a profit.
If you keep track of the conversion of $US to Yen you'd want to Buy high and Sell low.
On the other hand, if you keep track of the conversion of Yen to $US you'd want to Buy low and Sell high.
>Pips? Did you say pips?
Yeah, that's FOREX-speak that I'm learning.
It's the change in the last couple of digits ... or, normally, it's
10,000*(the change)
If the U.S Dollar changes from 1.5289 Canadian Dollars
to 1.5279 then it's decreased by .001 or 10 "pips".
If the EURO changes from 1.4666 Swiss Francs
to 1.4689 then it's increased by .0023 or 23 "pips".
If the Australian Dollar changes from ...
|
>Yeah, okay ... but what about trading?
We'll get to that in a minute. In the meantime, play here 
|
|
Okay, here we go:
- We look at the exchange between British Pounds and the U.S Dollar ... in FOREX-speak, that's called GBP/USD
- It's currently 1.499 ... so one Pound buys 1.499 $US
- You expect the pound to go up against the dollar, so you buy $100,000 worth of pounds ... paying in U.S. dollars
- Some time later the pound moves up to 1.505 ... that's an increase of 60 pips in the value of the pound
- That increase from 1.499 to 1.505 is 0.4%
... that's an Percentage increase of 100(1.505 - 1.499) / 1.499 = 0.60/1.499 = 0.400% - So you've made 400 $US on your $100K investment.
>Big deal!
Aah, but here's the clincher. To trade with $100K, you only have to put up $1K
... the remaining $99K being "borrowed" (a line of credit)
That means you've made $400 with a $1,000 investment ... and that's a 40% gain 
>You only have to put up1%? You trade with $100K with just $1K?
Well, it depends. Sometimes it's 2% or maybe it's 5%. It depends upon your FOREX broker.
But even if you had to put up 2% (that's $2,000) you'd make $400 on $2K and that's still 20%.
>Or you could lose 20%, eh?
Uh ... yes.
|
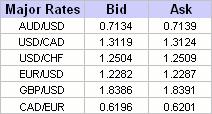
Just like stocks, there's a Bid and Ask.
You buy at the Ask and (later!) sell at the Bid. >Praying that the Bid is eventually greater than the original Ask, right?
| 
|
A FOREX quote like USD/DEM = 1.8172 / 77 means the quoting bank would:
Buy (or Bid) USD at 1.8172 DEM per USD and
Sell (or Ask) USD at 1.8177 DEM per USD.
>I take it these exchange rates can change dramatically, eh?
Sometimes.
|
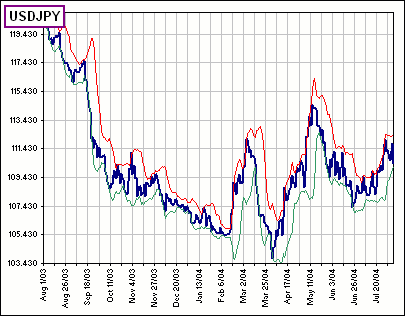
Figure 1 shows the daily closing rates for USD/JPY
(over the past year).
There's a drop of about 8% and the volatility (annualized) is about 10%. In general, however, I find that changes in exchange rates are much less volatile than changes in stock prices. The difference (of course) is the HUGE leverage in FOREX trading! You play with $100K using just $2K of your own money! >And play with $98K of somebuddy else's money The "Major Rates" include exchange rates between:
|  Figure 1 |
>I can see how you can examine a company and decide if it's a good buy ... but a country?
| Well ... you could still use Technical Analysis.
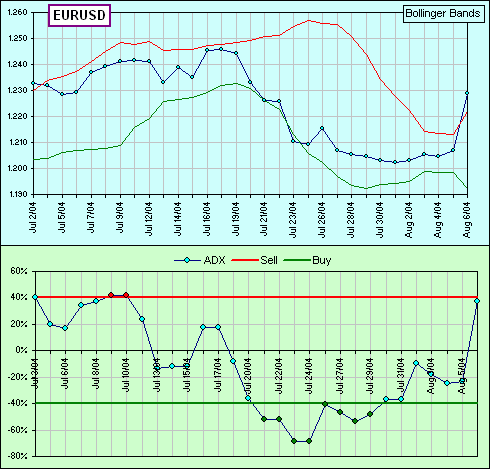
For example, Figure 1 shows upper and lower Bollinger Bands for USD/JPY and, in Figure 2, the last month of daily closes and Bollinger Bands and an ADX* Buy/Sell chart for EUR/USD. >You're saying to Buy when the EURO is low and Sell when it's high? Isn't that the ol' Buy Low / Sell High? Yes.
>The change from from 1.24 to 1.21 is 0.03 Yes. I understand that the 10,000 is "normal" for EUR/USD, GBD/USD, USD/CHF ... but it's 100 in the case of USD/JPY. If USD changes from 110.40 Yen to 110.32 Yen, that's a change of 8 pips. >I assume there's a spreadsheet?
|  Figure 2 |
In the meantime, I think I'll play with a DEMO account. It should be fun

P.S. The notation USD/JPY = 112.34 (for example)
does not mean the number of USD per JPY.
It means a USD will buy 112.34 Yen !!
>I'd use the notation JPY/USD for the number of JPY per USD!
|
The first currency is the so-called Base Currency so USD/JPY
means USD is the Base and JPY is the Quote Currency.
For example:
| 
|
* The usual definition for ADX is a moving average of (+DI) - (-DI) while the lower chart in Figure 2 is [(+DI) - (-DI)] / [(+DI) + (-DI)]
Some Links:
4x Made easy
Historical Rates
Practice Trading with a Demo Account 

