|
There are two (at least) Dollar Cost Averaging problems:
- You've got $100/month to invest. Is it best to invest it each month (that's DCA) or should
you collect the $100 each month under your pillow, waiting till the market goes UP or DOWN (or some
such criterion) ... then invest all of what's under the pillow?
- You've got LOTS of money (you sold
your house, your uncle died, etc.). Is it best to put it into the market All-At-Once or should you DCA:
say 6 equal investments over 6 months, starting immediately ? (we'll call this DCA/6) or 12 lump sums
over 12 months (DCA/12), etc.
Note that DCA/1 (that is, 1 equal investment over 1 month, starting
immediately) is the same as "All-At-Once".
After playing with Problem 1 for awhile, I'm convinced
that DCAing your $100/month is a very good strategy.
(See DCA Part #1)
>What about a third problem? Whether you beat the S&P 500 if you ...?
I think the jury's out there. If one DCA'd in the S&P 500, equal amounts for ten successive
years, then compared to the S&P 500 gain, you'd get:

But, I'd like to talk about Problem 2, because somebody
advised DCAing over 12 months or something (... sorry, can't remember who or where).
That's DCA/12.
Now the road gets bumpy so you may want to turn back ... else, if you're a masochist ...
>And if I'm not a masochist?
Pay attention:
Suppose you have LOTS of money, say $A, and divide it into N
equal parts (namely A/N) and you invest
each part over the next N months (with the first part invested
immediately).
Important note:
If you buy $K worth of units at $P per unit, you get K/P units. Okay, suppose the unit price starts
at $P and the Gain Factors over one month, two months, three months, etc. are called G1,
G2, G3, etc. then the unit price at the end of month one is PG1,
and at the end of two months is PG2, etc.
NOTE about what I mean by these "
Gain Factors":
If the total gain over two months is 5.3%, then G2 = 1.053
If the
total gain over seven months is 12.3%, then G7 = 1.123
>So how many units do you
own after N months of DCAing?
You buy (A/N)/P units immediately ('cause you buy $A/N worth of units
at $P per unit).
At the start of the next month you buy (A/N)/(PG1) units.
At the
start of the next month you buy (A/N)/(PG2) units.
...
At the start of the
last month you buy (A/N)/(PGN-1) units.
Total number of units purchased
(with N purchases of $A/N each) is:
(A/N)/P + (A/N)/(PG1) + (A/N)/(PG2) + ... + (A/N)/(PGN-1)
Count 'em ... there are N purchases here.
The number of units (above)
can be rewritten:
(A/P)(1/N)(1+1/G1+1/G2+...+1/GN-1)
and, behold,
the last piece, namely
(1/N)(1+1/G1+1/G2+...+1/GN-1)
is the average of the reciprocals of the gain factors over zero, one, two,
etc. months.
We'll call this average Q (why not?) so the number of units
you hold after N DCA investments
is (A/P)Q.
>How about if you purchased all your units at the start?
You'd have $A to spend
All-At-Once and each unit costs $P so you'd have
A/P units.
>So, are you better off with (A/P)Q units
(I guess that's DCA/N),
or A/P units ... that's DCA/1, right?
DCA/N wins only if Q > 1. Okay, if you're still here ... are you still here?
>Just barely ...
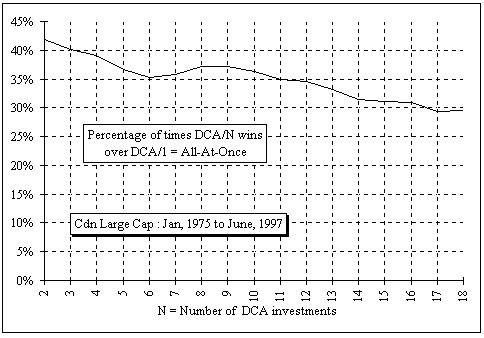
Let me show you what would have happened over the
270 months between Jan, 1975 and Jun, 1997:
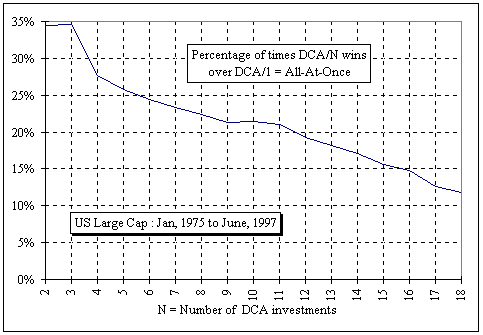
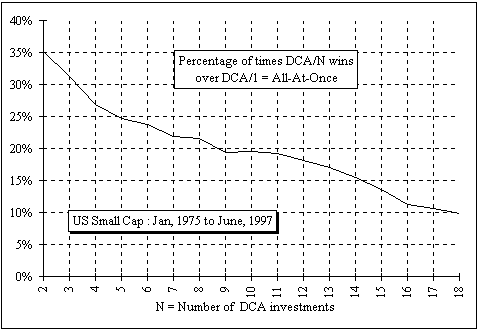
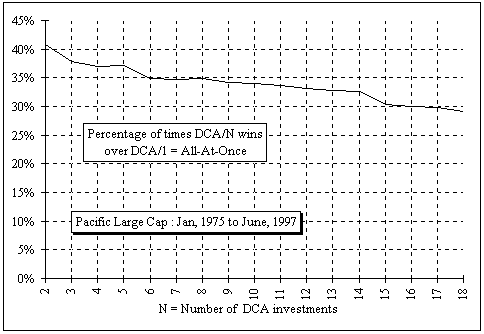
For each month, I considered DCA/2, DCA/3 up to
DCA/18 (this last guy means you invest eighteen times over 18 months) where the investments are in
Canadian Large Caps ('cause I happen to have this data) ... and then I counted the number of times you would
have won against DCA/1 = All-At-Once:
>Other markets?
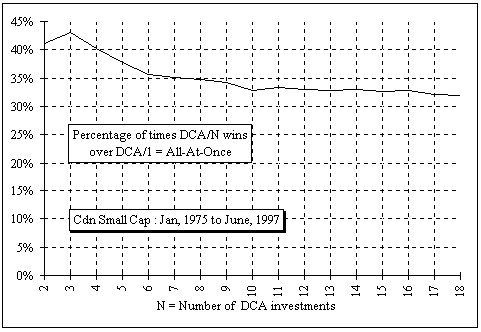
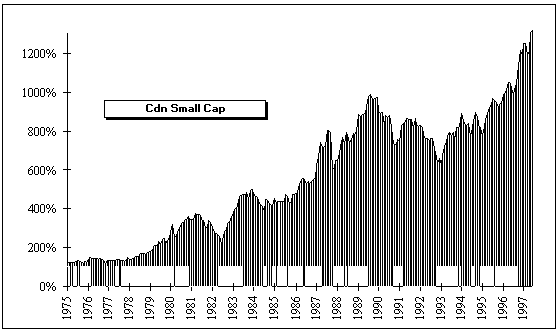
Cdn Small Cap
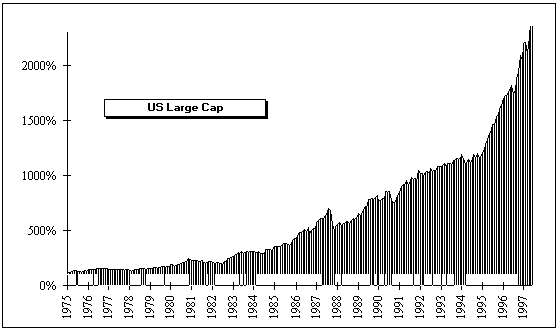
US Large Cap
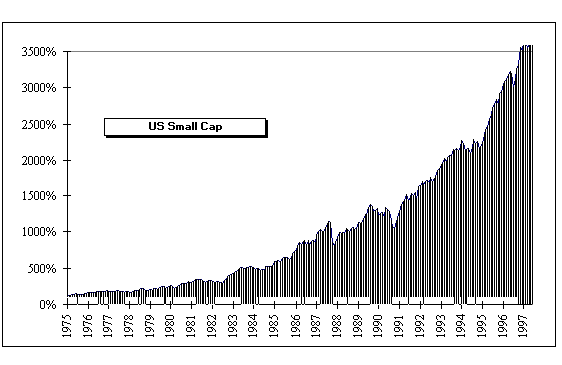
US Small Cap
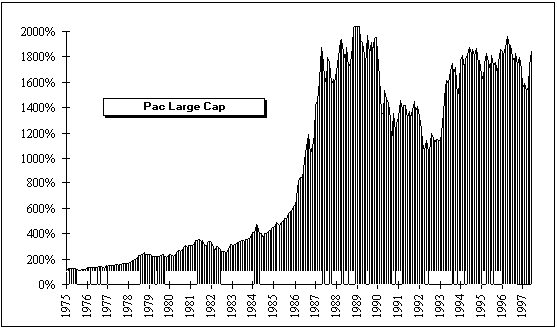
Pacific Large Cap
... and, if you want to see what these markets looked like
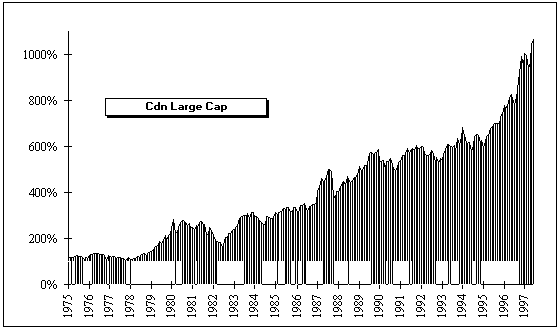
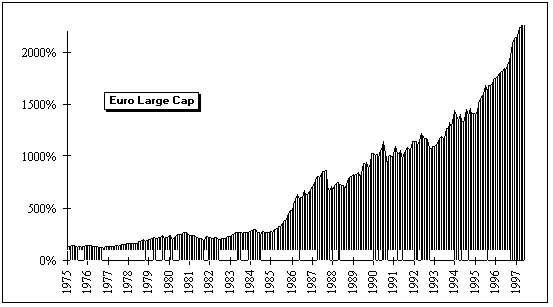
(where the wee rectangles are the periods over
which DCA/1 wins over DCA/10):
Canadian Small Cap
Canadian Large Cap
U.S. Large Cap
U.S. Small Cap
European Large Cap
Pacific Large Cap
Anybody still awake?
Okay, pay attention. Here's a neat graphical thingy:
We can plot the Cumulative Gains for our portfolio
... a plot of 1, G1,
G2, G2, ... GN-1.
That's the Red guy 
On the other hand, we
can also plot their reciprocals:
1, 1/G1, 1/G2, ... 1/GN-1
That's the Blue guy
The Area under the blue guy is
1 + 1/G1 + 1/G2 + ... + 1/GN-1
(In this example, it's 10.2)
| 
|
Did I mention that (as an example) we're talking about DCAing into the S&P 500,
over N=12 months, starting in January, 1954?
Anyway, if we divide the Area by N (for an
N-month DCA) we get (surprise!)
Q = (1/N)(1 + 1/G1 + 1/G2 + ... + 1/GN-1
>You're trying to tell me something, right?
I'm saying that if that Area is less than N, then
Q < 1 and investing All-at-Once wins over DCA.
>So the Blue Area
should be less than the Green Area , right?
Right.
>So, if the Gains are good ones:
- the Red goes up and
- the Blue goes down and
- Blue Area is smaller than
Green Area and
- DCA loses.
Yes, but not in 1953 ... but you can play with a ZIPd spreadsheet. Just
RIGHT-CLICK HERE
and "Save the Target" file.
(The spreadsheet looks like
this.)
>But what if I keep my uninvested DCA money in, say, Money Market at 3%?
Then the sum gets changed to:
Q = (1/N)
{
1 + (1+M)/G1 + (1+M)2/G2 + ... + (1+M)N-1/GN-1
}
where M is the monthly Money Market rate.
>What about DCAing out of your investments?
Aah ... good question.
We can repeat the above analysis where we:
- Start with a portfolio worth $A
- We expect a market downturn and want to sell $A/N worth of stock each month
- After n months, when the stock price is $PGn, we sell
(A/N)/(PGn) units
- After N such sales, we've sold how many units?
(A/N)/P + (A/N)/(PG1) + (A/N)/(PG2) + ... + (A/N)/(PGN-1)
= (A/P)(1/N)(1+1/G1+1/G2+...+1/GN-1)
- Hence the total units (or shares) sold after N months is (A/P)Q where, as before:
Q = (1/N)(1+1/G1+1/G2+...+1/GN-1)
- Had we sold everything at the beginning, we'd have sold $A worth of shares at
$P per share, so we'd have sold all A/P shares we originally held.
- If Q > 1 then the sale of
$A/N worth of stock each month would leave us with no shares left, before N
months had elapsed. Had we managed to last for N months (Q < 1), we'd have
collected $A/N each month for N months, a total of $A, and we'd still have
shares left in our stock. Hence ...
>Hence, if Q < 1, we'd be ahead by DCAing out, compared to selling all-at-once.
Right.
>So, the times when buying into the market, all-at-once,
is better (than DCAing into the market) ... that's when Q < 1
... them's the times when
selling all-at-once is worser (than DCAing out of the market).
Right. If the market is heading UP, and you're going to sell, then sell a bit at a time.
>Assuming you're selling a fixed dollar amount each time.
Right. However, you might also consider selling a fixed number of units
... as we'd mentioned in Part I.
>The Market Data, can we trust it? Where'd it come from?
Uh ... the data for the various large/small cap markets was obtained here:

Perhaps the moral here, for DCAing into the market, is: "Invest as soon as you have the money."
>Didn't Templeton say that?
If it's a lump sum, invest it all.
If it's $100/month, invest it monthly ... and call it DCA. It'll make
you feel warm all over.
>Very funny ...

I forgot to mention that, when you DCA over N months, you have
invested A dollars and have (A/P)Q units so your average unit cost is their
ratio which is P/Q dollars per unit. For all-at-once, the average price you paid is
just P (since y'all just bought units once). If Q > 1, then the DCA average is
less, eh?
>So?
So, since Q = (1/N)(1+1/G1+1/G2+...+1/GN-1)
then Q > 1 requires this sum to exceed "1" which will certainly be the case if the gains
G1, G2, etc. were all less than "1", meaning
a bear market.
>So DCA is good in a bear market?
Sure. You buy units at lower and lower prices.
>What about the bulls?
If the gains changed geometrically ... or, let's say, exponentially, with
G1 = g and G2 = g2
and G3 = g3 etc., then
Q = (1/N)(1 + g-1 + g-2 + g-2 +
... + g-(N-1))
>Geometrically is the same as exponentially?
Yes. Pay attention.
There's a magic formula for the sum of that geometric series. We have:
Q = (1/N)(g-N - 1)/(g-1 - 1)
and I leave it as an exercise to determine when this is greater than "1" ... and when it's less.
>Thanks. How come you don't have any pictures?
Here's a picture.
Also, if you'd like, you can play with DCA vs All-at-once yourself.
There's a spreadsheet you can download and it looks like this:
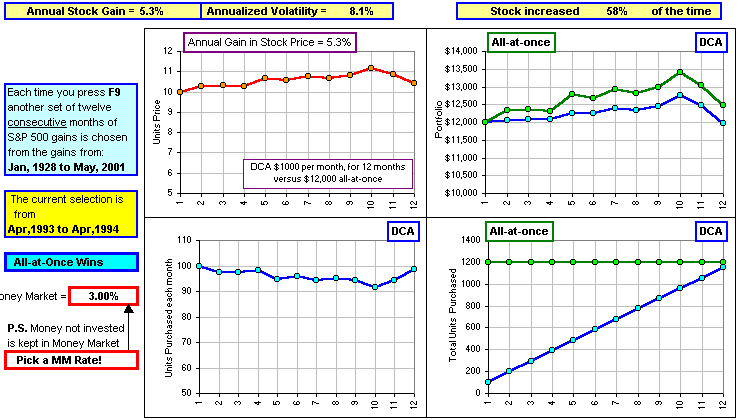
RIGHT-click on the picture and Save Target to download the .ZIP'd spreadsheet.
I'm surprised that you're still awake.
>zzzzz
|

)